Salvadoran vs Norwegian In Labor Force | Age > 16
COMPARE
Salvadoran
Norwegian
In Labor Force | Age > 16
In Labor Force | Age > 16 Comparison
Salvadorans
Norwegians
66.8%
IN LABOR FORCE | AGE > 16
100.0/ 100
METRIC RATING
39th/ 347
METRIC RANK
65.7%
IN LABOR FORCE | AGE > 16
95.3/ 100
METRIC RATING
125th/ 347
METRIC RANK
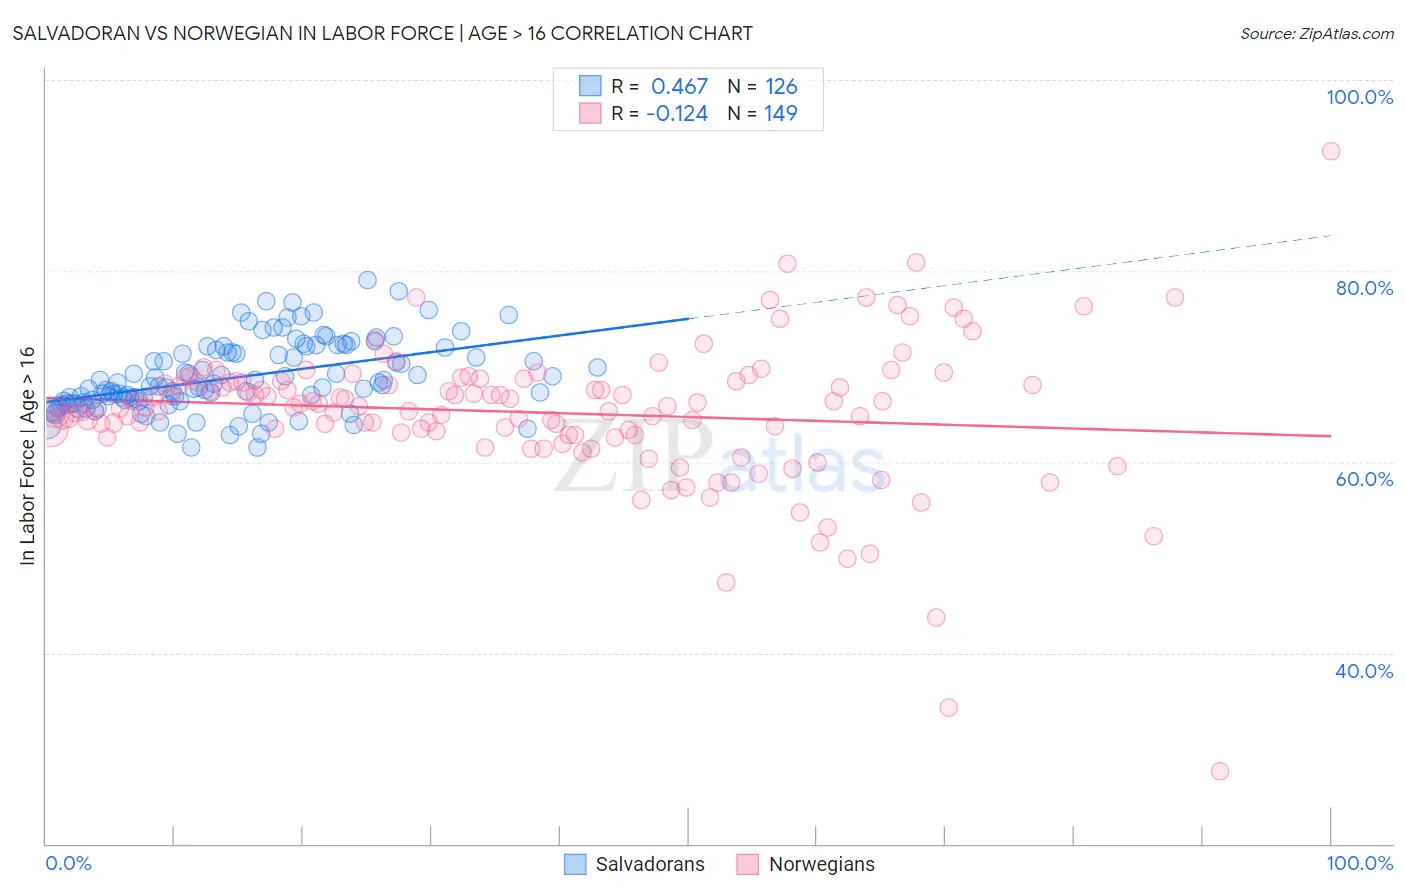
Salvadoran vs Norwegian In Labor Force | Age > 16 Correlation Chart
The statistical analysis conducted on geographies consisting of 399,019,559 people shows a moderate positive correlation between the proportion of Salvadorans and labor force participation rate among population ages 16 and over in the United States with a correlation coefficient (R) of 0.467 and weighted average of 66.8%. Similarly, the statistical analysis conducted on geographies consisting of 533,394,126 people shows a poor negative correlation between the proportion of Norwegians and labor force participation rate among population ages 16 and over in the United States with a correlation coefficient (R) of -0.124 and weighted average of 65.7%, a difference of 1.8%.
In Labor Force | Age > 16 Correlation Summary
| Measurement | Salvadoran | Norwegian |
| Minimum | 61.5% | 27.6% |
| Maximum | 79.0% | 92.5% |
| Range | 17.5% | 64.9% |
| Mean | 68.9% | 65.2% |
| Median | 67.9% | 65.8% |
| Interquartile 25% (IQ1) | 66.3% | 62.9% |
| Interquartile 75% (IQ3) | 71.7% | 68.5% |
| Interquartile Range (IQR) | 5.4% | 5.5% |
| Standard Deviation (Sample) | 3.7% | 7.5% |
| Standard Deviation (Population) | 3.7% | 7.5% |
Similar Demographics by In Labor Force | Age > 16
Demographics Similar to Salvadorans by In Labor Force | Age > 16
In terms of in labor force | age > 16, the demographic groups most similar to Salvadorans are Immigrants from El Salvador (66.8%, a difference of 0.020%), Immigrants from Zimbabwe (66.8%, a difference of 0.020%), Senegalese (66.7%, a difference of 0.11%), Luxembourger (66.7%, a difference of 0.14%), and Immigrants from Nigeria (66.9%, a difference of 0.16%).
| Demographics | Rating | Rank | In Labor Force | Age > 16 |
| Immigrants | Congo | 100.0 /100 | #32 | Exceptional 67.1% |
| Afghans | 100.0 /100 | #33 | Exceptional 67.1% |
| Immigrants | Ghana | 100.0 /100 | #34 | Exceptional 67.1% |
| Immigrants | South Central Asia | 100.0 /100 | #35 | Exceptional 67.1% |
| Immigrants | Western Africa | 100.0 /100 | #36 | Exceptional 67.1% |
| Immigrants | Afghanistan | 100.0 /100 | #37 | Exceptional 67.0% |
| Immigrants | Nigeria | 100.0 /100 | #38 | Exceptional 66.9% |
| Salvadorans | 100.0 /100 | #39 | Exceptional 66.8% |
| Immigrants | El Salvador | 100.0 /100 | #40 | Exceptional 66.8% |
| Immigrants | Zimbabwe | 100.0 /100 | #41 | Exceptional 66.8% |
| Senegalese | 100.0 /100 | #42 | Exceptional 66.7% |
| Luxembourgers | 100.0 /100 | #43 | Exceptional 66.7% |
| Immigrants | Pakistan | 100.0 /100 | #44 | Exceptional 66.7% |
| Immigrants | Brazil | 100.0 /100 | #45 | Exceptional 66.7% |
| Brazilians | 100.0 /100 | #46 | Exceptional 66.6% |
Demographics Similar to Norwegians by In Labor Force | Age > 16
In terms of in labor force | age > 16, the demographic groups most similar to Norwegians are Korean (65.7%, a difference of 0.0%), Immigrants from Iraq (65.7%, a difference of 0.010%), Iraqi (65.7%, a difference of 0.010%), Immigrants from Eastern Asia (65.7%, a difference of 0.030%), and Ecuadorian (65.6%, a difference of 0.030%).
| Demographics | Rating | Rank | In Labor Force | Age > 16 |
| Immigrants | Thailand | 96.6 /100 | #118 | Exceptional 65.7% |
| Immigrants | France | 96.4 /100 | #119 | Exceptional 65.7% |
| Immigrants | Hong Kong | 96.2 /100 | #120 | Exceptional 65.7% |
| New Zealanders | 96.0 /100 | #121 | Exceptional 65.7% |
| Immigrants | Ecuador | 95.9 /100 | #122 | Exceptional 65.7% |
| Immigrants | Iraq | 95.5 /100 | #123 | Exceptional 65.7% |
| Iraqis | 95.4 /100 | #124 | Exceptional 65.7% |
| Norwegians | 95.3 /100 | #125 | Exceptional 65.7% |
| Koreans | 95.3 /100 | #126 | Exceptional 65.7% |
| Immigrants | Eastern Asia | 94.9 /100 | #127 | Exceptional 65.7% |
| Ecuadorians | 94.7 /100 | #128 | Exceptional 65.6% |
| Immigrants | Philippines | 94.5 /100 | #129 | Exceptional 65.6% |
| Immigrants | Guatemala | 94.4 /100 | #130 | Exceptional 65.6% |
| Icelanders | 94.3 /100 | #131 | Exceptional 65.6% |
| Immigrants | North Macedonia | 94.1 /100 | #132 | Exceptional 65.6% |