Spanish vs Norwegian Wage/Income Gap
COMPARE
Spanish
Norwegian
Wage/Income Gap
Wage/Income Gap Comparison
Spanish
Norwegians
27.1%
WAGE/INCOME GAP
3.6/ 100
METRIC RATING
243rd/ 347
METRIC RANK
29.0%
WAGE/INCOME GAP
0.1/ 100
METRIC RATING
323rd/ 347
METRIC RANK
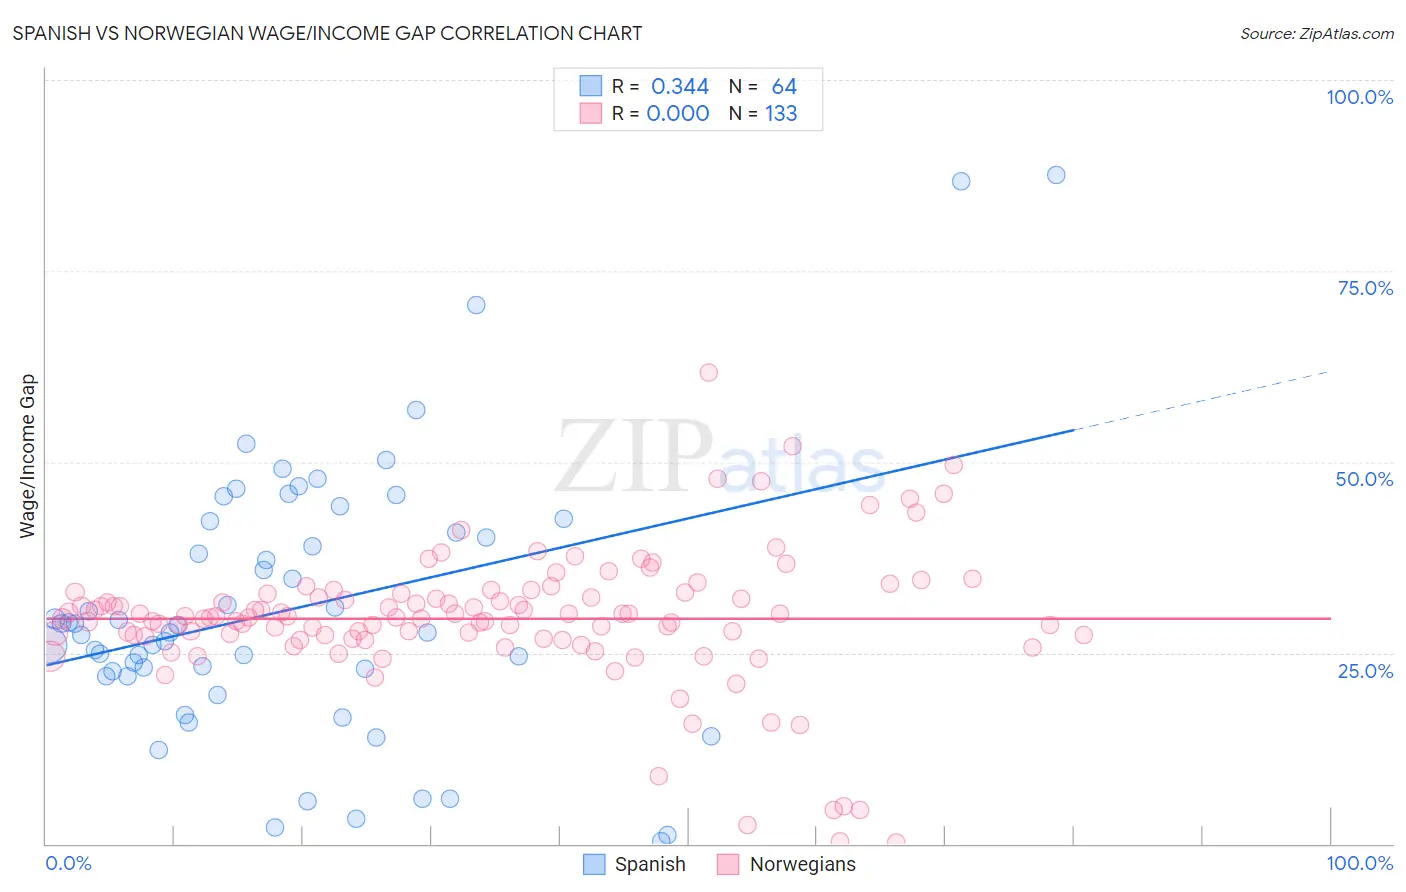
Spanish vs Norwegian Wage/Income Gap Correlation Chart
The statistical analysis conducted on geographies consisting of 421,731,243 people shows a mild positive correlation between the proportion of Spanish and wage/income gap percentage in the United States with a correlation coefficient (R) of 0.344 and weighted average of 27.1%. Similarly, the statistical analysis conducted on geographies consisting of 531,696,723 people shows no correlation between the proportion of Norwegians and wage/income gap percentage in the United States with a correlation coefficient (R) of 0.000 and weighted average of 29.0%, a difference of 6.7%.
Wage/Income Gap Correlation Summary
| Measurement | Spanish | Norwegian |
| Minimum | 0.38% | 0.24% |
| Maximum | 87.5% | 61.7% |
| Range | 87.2% | 61.5% |
| Mean | 30.8% | 29.5% |
| Median | 28.1% | 29.7% |
| Interquartile 25% (IQ1) | 22.3% | 27.0% |
| Interquartile 75% (IQ3) | 41.5% | 32.7% |
| Interquartile Range (IQR) | 19.1% | 5.7% |
| Standard Deviation (Sample) | 17.7% | 9.0% |
| Standard Deviation (Population) | 17.6% | 8.9% |
Similar Demographics by Wage/Income Gap
Demographics Similar to Spanish by Wage/Income Gap
In terms of wage/income gap, the demographic groups most similar to Spanish are Immigrants from Sri Lanka (27.1%, a difference of 0.010%), Creek (27.1%, a difference of 0.060%), Chickasaw (27.2%, a difference of 0.070%), Immigrants from Europe (27.1%, a difference of 0.080%), and Immigrants from the Azores (27.2%, a difference of 0.090%).
| Demographics | Rating | Rank | Wage/Income Gap |
| Immigrants | Romania | 4.8 /100 | #236 | Tragic 27.0% |
| Immigrants | Eastern Asia | 4.4 /100 | #237 | Tragic 27.1% |
| Osage | 4.4 /100 | #238 | Tragic 27.1% |
| Estonians | 4.3 /100 | #239 | Tragic 27.1% |
| Immigrants | Europe | 3.8 /100 | #240 | Tragic 27.1% |
| Creek | 3.8 /100 | #241 | Tragic 27.1% |
| Immigrants | Sri Lanka | 3.7 /100 | #242 | Tragic 27.1% |
| Spanish | 3.6 /100 | #243 | Tragic 27.1% |
| Chickasaw | 3.5 /100 | #244 | Tragic 27.2% |
| Immigrants | Azores | 3.5 /100 | #245 | Tragic 27.2% |
| Immigrants | Nonimmigrants | 3.3 /100 | #246 | Tragic 27.2% |
| Celtics | 2.8 /100 | #247 | Tragic 27.3% |
| Cypriots | 2.8 /100 | #248 | Tragic 27.3% |
| Carpatho Rusyns | 2.7 /100 | #249 | Tragic 27.3% |
| Immigrants | Czechoslovakia | 2.7 /100 | #250 | Tragic 27.3% |
Demographics Similar to Norwegians by Wage/Income Gap
In terms of wage/income gap, the demographic groups most similar to Norwegians are Immigrants from Singapore (28.9%, a difference of 0.11%), Croatian (29.0%, a difference of 0.12%), Welsh (28.9%, a difference of 0.13%), British (28.9%, a difference of 0.19%), and Slovak (28.9%, a difference of 0.25%).
| Demographics | Rating | Rank | Wage/Income Gap |
| Lithuanians | 0.1 /100 | #316 | Tragic 28.7% |
| Belgians | 0.1 /100 | #317 | Tragic 28.8% |
| Basques | 0.1 /100 | #318 | Tragic 28.8% |
| Slovaks | 0.1 /100 | #319 | Tragic 28.9% |
| British | 0.1 /100 | #320 | Tragic 28.9% |
| Welsh | 0.1 /100 | #321 | Tragic 28.9% |
| Immigrants | Singapore | 0.1 /100 | #322 | Tragic 28.9% |
| Norwegians | 0.1 /100 | #323 | Tragic 29.0% |
| Croatians | 0.0 /100 | #324 | Tragic 29.0% |
| Hungarians | 0.0 /100 | #325 | Tragic 29.0% |
| Immigrants | Belgium | 0.0 /100 | #326 | Tragic 29.0% |
| Immigrants | Iran | 0.0 /100 | #327 | Tragic 29.1% |
| Scandinavians | 0.0 /100 | #328 | Tragic 29.1% |
| Scottish | 0.0 /100 | #329 | Tragic 29.1% |
| Germans | 0.0 /100 | #330 | Tragic 29.2% |