Puerto Rican vs Immigrants from Taiwan Divorced or Separated
COMPARE
Puerto Rican
Immigrants from Taiwan
Divorced or Separated
Divorced or Separated Comparison
Puerto Ricans
Immigrants from Taiwan
13.9%
DIVORCED OR SEPARATED
0.0/ 100
METRIC RATING
333rd/ 347
METRIC RANK
9.8%
DIVORCED OR SEPARATED
100.0/ 100
METRIC RATING
1st/ 347
METRIC RANK
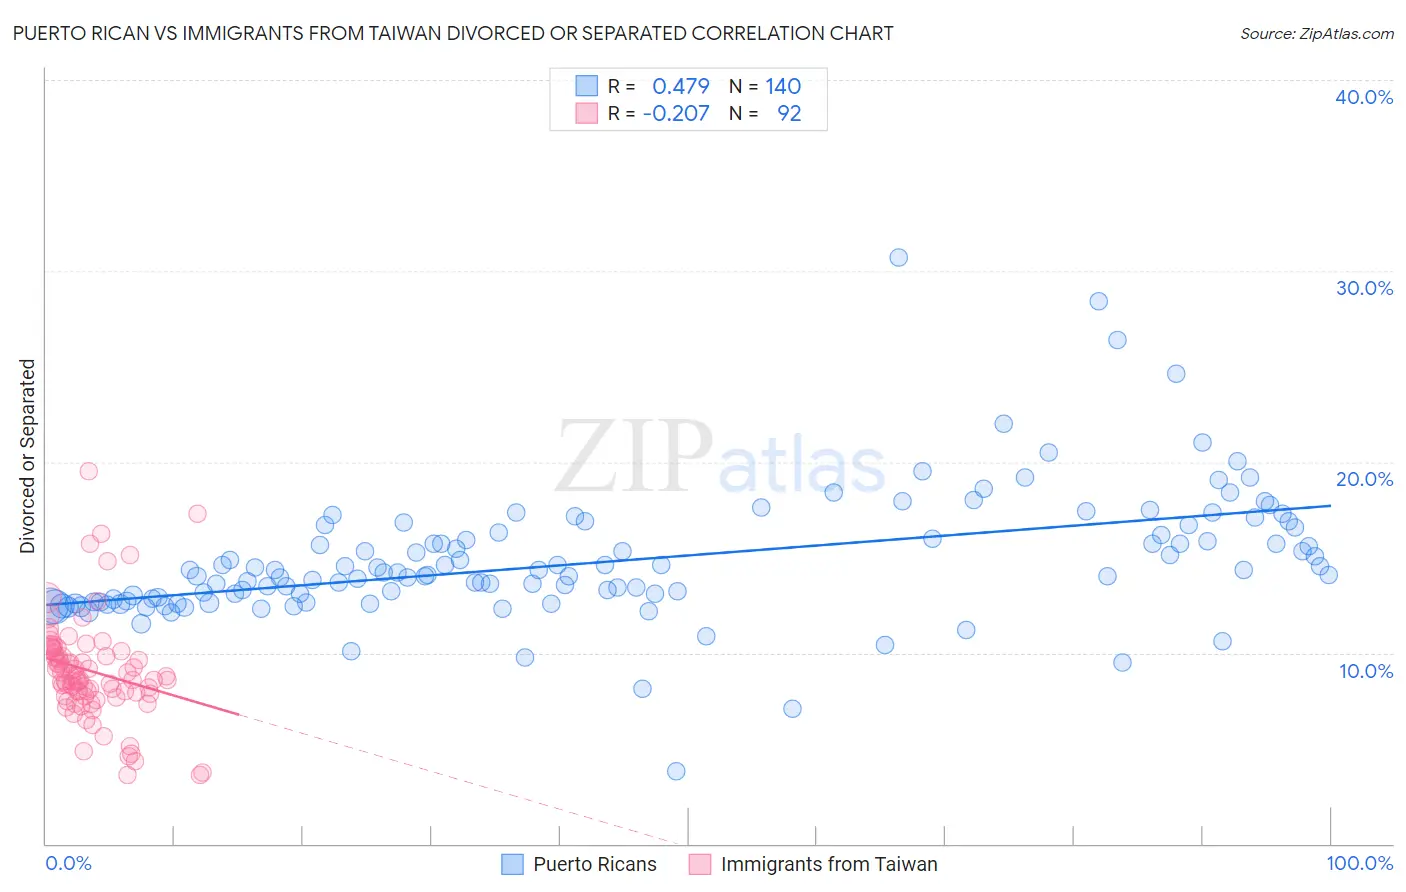
Puerto Rican vs Immigrants from Taiwan Divorced or Separated Correlation Chart
The statistical analysis conducted on geographies consisting of 527,942,852 people shows a moderate positive correlation between the proportion of Puerto Ricans and percentage of population currently divorced or separated in the United States with a correlation coefficient (R) of 0.479 and weighted average of 13.9%. Similarly, the statistical analysis conducted on geographies consisting of 298,143,360 people shows a weak negative correlation between the proportion of Immigrants from Taiwan and percentage of population currently divorced or separated in the United States with a correlation coefficient (R) of -0.207 and weighted average of 9.8%, a difference of 41.3%.
Divorced or Separated Correlation Summary
| Measurement | Puerto Rican | Immigrants from Taiwan |
| Minimum | 3.8% | 3.6% |
| Maximum | 30.7% | 19.5% |
| Range | 26.9% | 15.9% |
| Mean | 14.8% | 9.0% |
| Median | 14.1% | 8.6% |
| Interquartile 25% (IQ1) | 12.7% | 7.8% |
| Interquartile 75% (IQ3) | 16.2% | 10.0% |
| Interquartile Range (IQR) | 3.5% | 2.2% |
| Standard Deviation (Sample) | 3.4% | 2.7% |
| Standard Deviation (Population) | 3.4% | 2.7% |
Similar Demographics by Divorced or Separated
Demographics Similar to Puerto Ricans by Divorced or Separated
In terms of divorced or separated, the demographic groups most similar to Puerto Ricans are Immigrants from Bahamas (13.9%, a difference of 0.34%), Cherokee (13.7%, a difference of 0.95%), Dutch West Indian (14.0%, a difference of 0.95%), Shoshone (14.0%, a difference of 1.3%), and Crow (14.1%, a difference of 1.6%).
| Demographics | Rating | Rank | Divorced or Separated |
| Immigrants | Congo | 0.0 /100 | #326 | Tragic 13.5% |
| Comanche | 0.0 /100 | #327 | Tragic 13.5% |
| Immigrants | Caribbean | 0.0 /100 | #328 | Tragic 13.6% |
| Houma | 0.0 /100 | #329 | Tragic 13.6% |
| Paiute | 0.0 /100 | #330 | Tragic 13.6% |
| Blacks/African Americans | 0.0 /100 | #331 | Tragic 13.6% |
| Cherokee | 0.0 /100 | #332 | Tragic 13.7% |
| Puerto Ricans | 0.0 /100 | #333 | Tragic 13.9% |
| Immigrants | Bahamas | 0.0 /100 | #334 | Tragic 13.9% |
| Dutch West Indians | 0.0 /100 | #335 | Tragic 14.0% |
| Shoshone | 0.0 /100 | #336 | Tragic 14.0% |
| Crow | 0.0 /100 | #337 | Tragic 14.1% |
| Choctaw | 0.0 /100 | #338 | Tragic 14.1% |
| Colville | 0.0 /100 | #339 | Tragic 14.2% |
| Chickasaw | 0.0 /100 | #340 | Tragic 14.2% |
Demographics Similar to Immigrants from Taiwan by Divorced or Separated
In terms of divorced or separated, the demographic groups most similar to Immigrants from Taiwan are Filipino (9.9%, a difference of 1.1%), Immigrants from Hong Kong (10.0%, a difference of 1.6%), Immigrants from China (10.0%, a difference of 2.4%), Immigrants from India (10.1%, a difference of 2.6%), and Indian (Asian) (10.2%, a difference of 4.0%).
| Demographics | Rating | Rank | Divorced or Separated |
| Immigrants | Taiwan | 100.0 /100 | #1 | Exceptional 9.8% |
| Filipinos | 100.0 /100 | #2 | Exceptional 9.9% |
| Immigrants | Hong Kong | 100.0 /100 | #3 | Exceptional 10.0% |
| Immigrants | China | 100.0 /100 | #4 | Exceptional 10.0% |
| Immigrants | India | 100.0 /100 | #5 | Exceptional 10.1% |
| Indians (Asian) | 100.0 /100 | #6 | Exceptional 10.2% |
| Thais | 100.0 /100 | #7 | Exceptional 10.2% |
| Immigrants | Eastern Asia | 100.0 /100 | #8 | Exceptional 10.2% |
| Yup'ik | 100.0 /100 | #9 | Exceptional 10.3% |
| Immigrants | Singapore | 100.0 /100 | #10 | Exceptional 10.3% |
| Immigrants | South Central Asia | 100.0 /100 | #11 | Exceptional 10.4% |
| Okinawans | 100.0 /100 | #12 | Exceptional 10.5% |
| Cypriots | 100.0 /100 | #13 | Exceptional 10.5% |
| Assyrians/Chaldeans/Syriacs | 100.0 /100 | #14 | Exceptional 10.6% |
| Immigrants | Armenia | 100.0 /100 | #15 | Exceptional 10.6% |