Dominican vs Immigrants from Taiwan Wage/Income Gap

COMPARE

Dominican
Race
Ancestry
AfghanAfricanAlaska NativeAlaskan AthabascanAlbanianAleutAlsatianAmericanApacheArabArapahoArgentineanArmenianAssyrian/Chaldean/SyriacAustralianAustrianBahamianBangladeshiBarbadianBasqueBelgianBelizeanBermudanBhutaneseBlackfeetBolivianBrazilianBritishBritish West IndianBulgarianBurmeseCajunCambodianCanadianCape VerdeanCarpatho RusynCelticCentral AmericanCentral American IndianCherokeeCheyenneChickasawChileanChineseChippewaChoctawColombianColvilleComancheCosta RicanCreeCreekCroatianCrowCubanCypriotCzechCzechoslovakianDanishDelawareDominicanDutchDutch West IndianEastern EuropeanEcuadorianEgyptianEnglishEstonianEthiopianEuropeanFijianFilipinoFinnishFrenchFrench American IndianFrench CanadianGermanGerman RussianGhanaianGreekGuamanian/ChamorroGuatemalanGuyaneseHaitianHmongHonduranHopiHoumaHungarianIcelanderIndian (Asian)IndonesianInupiatIranianIraqiIrishIroquoisIsraeliItalianJamaicanJapaneseJordanianKenyanKiowaKoreanLaotianLatvianLebaneseLiberianLithuanianLumbeeLuxembourgerMacedonianMalaysianMalteseMarshalleseMenomineeMexicanMexican American IndianMongolianMoroccanNative HawaiianNavajoNepaleseNew ZealanderNicaraguanNigerianNorthern EuropeanNorwegianOkinawanOsageOttawaPaiutePakistaniPalestinianPanamanianParaguayanPennsylvania GermanPeruvianPimaPolishPortuguesePotawatomiPuebloPuerto RicanPuget Sound SalishRomanianRussianSalvadoranSamoanScandinavianScotch-IrishScottishSeminoleSenegaleseSerbianShoshoneSierra LeoneanSiouxSlavicSlovakSloveneSomaliSouth AfricanSouth AmericanSouth American IndianSoviet UnionSpaniardSpanishSpanish AmericanSpanish American IndianSri LankanSubsaharan AfricanSudaneseSwedishSwissSyrianTaiwaneseThaiTlingit-HaidaTohono O'OdhamTonganTrinidadian and TobagonianTsimshianTurkishU.S. Virgin IslanderUgandanUkrainianUruguayanUteVenezuelanVietnameseWelshWest IndianYakamaYaquiYugoslavianYumanYup'ikZimbabwean
Immigration
NonimmigrantsImmigrantsAfghanistanAfricaAlbaniaArgentinaArmeniaAsiaAustraliaAustriaBahamasBangladeshBarbadosBelarusBelgiumBelizeBoliviaBosnia and HerzegovinaBrazilBulgariaBurma/MyanmarCabo VerdeCambodiaCameroonCanadaCaribbeanCentral AmericaChileChinaColombiaCongoCosta RicaCroatiaCubaCzechoslovakiaDenmarkDominicaDominican RepublicEastern AfricaEastern AsiaEastern EuropeEcuadorEgyptEl SalvadorEnglandEritreaEthiopiaEuropeFijiFranceGermanyGhanaGreeceGrenadaGuatemalaGuyanaHaitiHondurasHong KongHungaryIndiaIndonesiaIranIraqIrelandIsraelItalyJamaicaJapanJordanKazakhstanKenyaKoreaKuwaitLaosLatin AmericaLatviaLebanonLiberiaLithuaniaMalaysiaMexicoMicronesiaMiddle AfricaMoldovaMoroccoNepalNetherlandsNicaraguaNigeriaNorth AmericaNorth MacedoniaNorthern AfricaNorthern EuropeNorwayOceaniaPakistanPanamaPeruPhilippinesPolandPortugalRomaniaRussiaSaudi ArabiaScotlandSenegalSerbiaSierra LeoneSingaporeSomaliaSouth AfricaSouth AmericaSouth Central AsiaSouth Eastern AsiaSouthern EuropeSpainSri LankaSt. Vincent and the GrenadinesSudanSwedenSwitzerlandSyriaThailandTrinidad and TobagoTurkeyUgandaUkraineUruguayUzbekistanVenezuelaVietnamWest IndiesWestern AfricaWestern AsiaWestern EuropeYemenZaireZimbabweAzores
Immigrants from Taiwan
Race
Ancestry
AfghanAfricanAlaska NativeAlaskan AthabascanAlbanianAleutAlsatianAmericanApacheArabArapahoArgentineanArmenianAssyrian/Chaldean/SyriacAustralianAustrianBahamianBangladeshiBarbadianBasqueBelgianBelizeanBermudanBhutaneseBlackfeetBolivianBrazilianBritishBritish West IndianBulgarianBurmeseCajunCambodianCanadianCape VerdeanCarpatho RusynCelticCentral AmericanCentral American IndianCherokeeCheyenneChickasawChileanChineseChippewaChoctawColombianColvilleComancheCosta RicanCreeCreekCroatianCrowCubanCypriotCzechCzechoslovakianDanishDelawareDutchDutch West IndianEastern EuropeanEcuadorianEgyptianEnglishEstonianEthiopianEuropeanFijianFilipinoFinnishFrenchFrench American IndianFrench CanadianGermanGerman RussianGhanaianGreekGuamanian/ChamorroGuatemalanGuyaneseHaitianHmongHonduranHopiHoumaHungarianIcelanderIndian (Asian)IndonesianInupiatIranianIraqiIrishIroquoisIsraeliItalianJamaicanJapaneseJordanianKenyanKiowaKoreanLaotianLatvianLebaneseLiberianLithuanianLumbeeLuxembourgerMacedonianMalaysianMalteseMarshalleseMenomineeMexicanMexican American IndianMongolianMoroccanNative HawaiianNavajoNepaleseNew ZealanderNicaraguanNigerianNorthern EuropeanNorwegianOkinawanOsageOttawaPaiutePakistaniPalestinianPanamanianParaguayanPennsylvania GermanPeruvianPimaPolishPortuguesePotawatomiPuebloPuerto RicanPuget Sound SalishRomanianRussianSalvadoranSamoanScandinavianScotch-IrishScottishSeminoleSenegaleseSerbianShoshoneSierra LeoneanSiouxSlavicSlovakSloveneSomaliSouth AfricanSouth AmericanSouth American IndianSoviet UnionSpaniardSpanishSpanish AmericanSpanish American IndianSri LankanSubsaharan AfricanSudaneseSwedishSwissSyrianTaiwaneseThaiTlingit-HaidaTohono O'OdhamTonganTrinidadian and TobagonianTsimshianTurkishU.S. Virgin IslanderUgandanUkrainianUruguayanUteVenezuelanVietnameseWelshWest IndianYakamaYaquiYugoslavianYumanYup'ikZimbabwean
Immigration
NonimmigrantsImmigrantsAfghanistanAfricaAlbaniaArgentinaArmeniaAsiaAustraliaAustriaBahamasBangladeshBarbadosBelarusBelgiumBelizeBoliviaBosnia and HerzegovinaBrazilBulgariaBurma/MyanmarCabo VerdeCambodiaCameroonCanadaCaribbeanCentral AmericaChileChinaColombiaCongoCosta RicaCroatiaCubaCzechoslovakiaDenmarkDominicaDominican RepublicEastern AfricaEastern AsiaEastern EuropeEcuadorEgyptEl SalvadorEnglandEritreaEthiopiaEuropeFijiFranceGermanyGhanaGreeceGrenadaGuatemalaGuyanaHaitiHondurasHong KongHungaryIndiaIndonesiaIranIraqIrelandIsraelItalyJamaicaJapanJordanKazakhstanKenyaKoreaKuwaitLaosLatin AmericaLatviaLebanonLiberiaLithuaniaMalaysiaMexicoMicronesiaMiddle AfricaMoldovaMoroccoNepalNetherlandsNicaraguaNigeriaNorth AmericaNorth MacedoniaNorthern AfricaNorthern EuropeNorwayOceaniaPakistanPanamaPeruPhilippinesPolandPortugalRomaniaRussiaSaudi ArabiaScotlandSenegalSerbiaSierra LeoneSingaporeSomaliaSouth AfricaSouth AmericaSouth Central AsiaSouth Eastern AsiaSouthern EuropeSpainSri LankaSt. Vincent and the GrenadinesSudanSwedenSwitzerlandSyriaTaiwanThailandTrinidad and TobagoTurkeyUgandaUkraineUruguayUzbekistanVenezuelaVietnamWest IndiesWestern AfricaWestern AsiaWestern EuropeYemenZaireZimbabweAzores
Wage/Income Gap
Income
Poverty
Unemployment
Labor Participation
Family Structure
Vehicle Availability
Education Level
Disability

Wage/Income Gap Comparison

Dominicans

Immigrants from Taiwan

Exceptional
Tragic
20.6%
WAGE/INCOME GAP
100.0/ 100
METRIC RATING
24th/ 347
METRIC RANK
29.5%
WAGE/INCOME GAP
0.0/ 100
METRIC RATING
335th/ 347
METRIC RANK

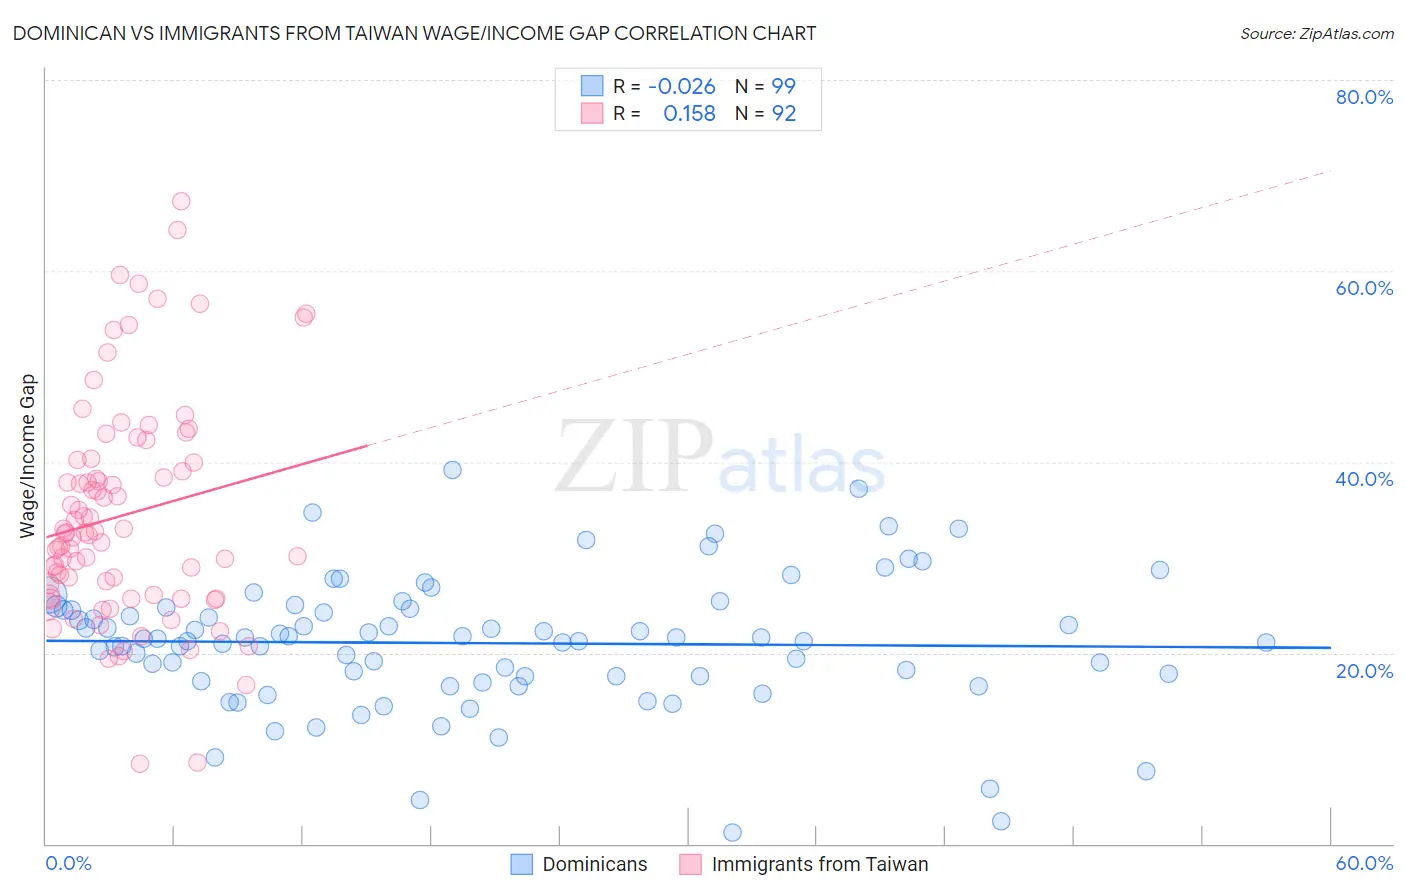
Dominican vs Immigrants from Taiwan Wage/Income Gap Correlation Chart

The statistical analysis conducted on geographies consisting of 354,862,114 people shows no correlation between the proportion of Dominicans and wage/income gap percentage in the United States with a correlation coefficient (R) of -0.026 and weighted average of 20.6%. Similarly, the statistical analysis conducted on geographies consisting of 298,208,657 people shows a poor positive correlation between the proportion of Immigrants from Taiwan and wage/income gap percentage in the United States with a correlation coefficient (R) of 0.158 and weighted average of 29.5%, a difference of 43.0%.
Dominican vs Immigrants from Taiwan Wage/Income Gap

Wage/Income Gap Correlation Summary

MeasurementDominicanImmigrants from Taiwan
Minimum1.2%8.4%
Maximum39.2%67.2%
Range37.9%58.8%
Mean21.0%34.4%
Median21.4%32.5%
Interquartile 25% (IQ1)17.5%26.0%
Interquartile 75% (IQ3)24.7%40.1%
Interquartile Range (IQR)7.2%14.1%
Standard Deviation (Sample)6.9%11.6%
Standard Deviation (Population)6.8%11.5%

Similar Demographics by Wage/Income Gap

Demographics Similar to Dominicans by Wage/Income Gap

In terms of wage/income gap, the demographic groups most similar to Dominicans are Immigrants from Dominican Republic (20.6%, a difference of 0.17%), Immigrants from Liberia (20.6%, a difference of 0.19%), Senegalese (20.7%, a difference of 0.30%), Pueblo (20.7%, a difference of 0.41%), and Immigrants from Armenia (20.7%, a difference of 0.62%).
DemographicsRating | RankWage/Income Gap
Haitians
100.0
/100
|
#17
Exceptional
19.7%
Hopi
100.0
/100
|
#18
Exceptional
20.0%
Immigrants | Dominica
100.0
/100
|
#19
Exceptional
20.0%
Bahamians
100.0
/100
|
#20
Exceptional
20.2%
Immigrants | Caribbean
100.0
/100
|
#21
Exceptional
20.4%
Immigrants | Liberia
100.0
/100
|
#22
Exceptional
20.6%
Immigrants | Dominican Republic
100.0
/100
|
#23
Exceptional
20.6%
Dominicans
100.0
/100
|
#24
Exceptional
20.6%
Senegalese
100.0
/100
|
#25
Exceptional
20.7%
Pueblo
100.0
/100
|
#26
Exceptional
20.7%
Immigrants | Armenia
100.0
/100
|
#27
Exceptional
20.7%
Inupiat
100.0
/100
|
#28
Exceptional
20.8%
Immigrants | Senegal
100.0
/100
|
#29
Exceptional
20.9%
Immigrants | Bangladesh
100.0
/100
|
#30
Exceptional
20.9%
Vietnamese
100.0
/100
|
#31
Exceptional
21.0%

Demographics Similar to Immigrants from Taiwan by Wage/Income Gap

In terms of wage/income gap, the demographic groups most similar to Immigrants from Taiwan are English (29.5%, a difference of 0.010%), Swedish (29.4%, a difference of 0.13%), European (29.4%, a difference of 0.27%), Immigrants from South Central Asia (29.3%, a difference of 0.46%), and Dutch (29.6%, a difference of 0.59%).
DemographicsRating | RankWage/Income Gap
Scandinavians
0.0
/100
|
#328
Tragic
29.1%
Scottish
0.0
/100
|
#329
Tragic
29.1%
Germans
0.0
/100
|
#330
Tragic
29.2%
Czechs
0.0
/100
|
#331
Tragic
29.2%
Immigrants | South Central Asia
0.0
/100
|
#332
Tragic
29.3%
Europeans
0.0
/100
|
#333
Tragic
29.4%
Swedes
0.0
/100
|
#334
Tragic
29.4%
Immigrants | Taiwan
0.0
/100
|
#335
Tragic
29.5%
English
0.0
/100
|
#336
Tragic
29.5%
Dutch
0.0
/100
|
#337
Tragic
29.6%
Filipinos
0.0
/100
|
#338
Tragic
29.7%
Iranians
0.0
/100
|
#339
Tragic
29.7%
Swiss
0.0
/100
|
#340
Tragic
30.0%
Thais
0.0
/100
|
#341
Tragic
30.5%
Pennsylvania Germans
0.0
/100
|
#342
Tragic
30.7%