Paraguayan vs Tsimshian Male Poverty
COMPARE
Paraguayan
Tsimshian
Male Poverty
Male Poverty Comparison
Paraguayans
Tsimshian
10.2%
MALE POVERTY
97.1/ 100
METRIC RATING
70th/ 347
METRIC RANK
12.8%
MALE POVERTY
0.3/ 100
METRIC RATING
244th/ 347
METRIC RANK
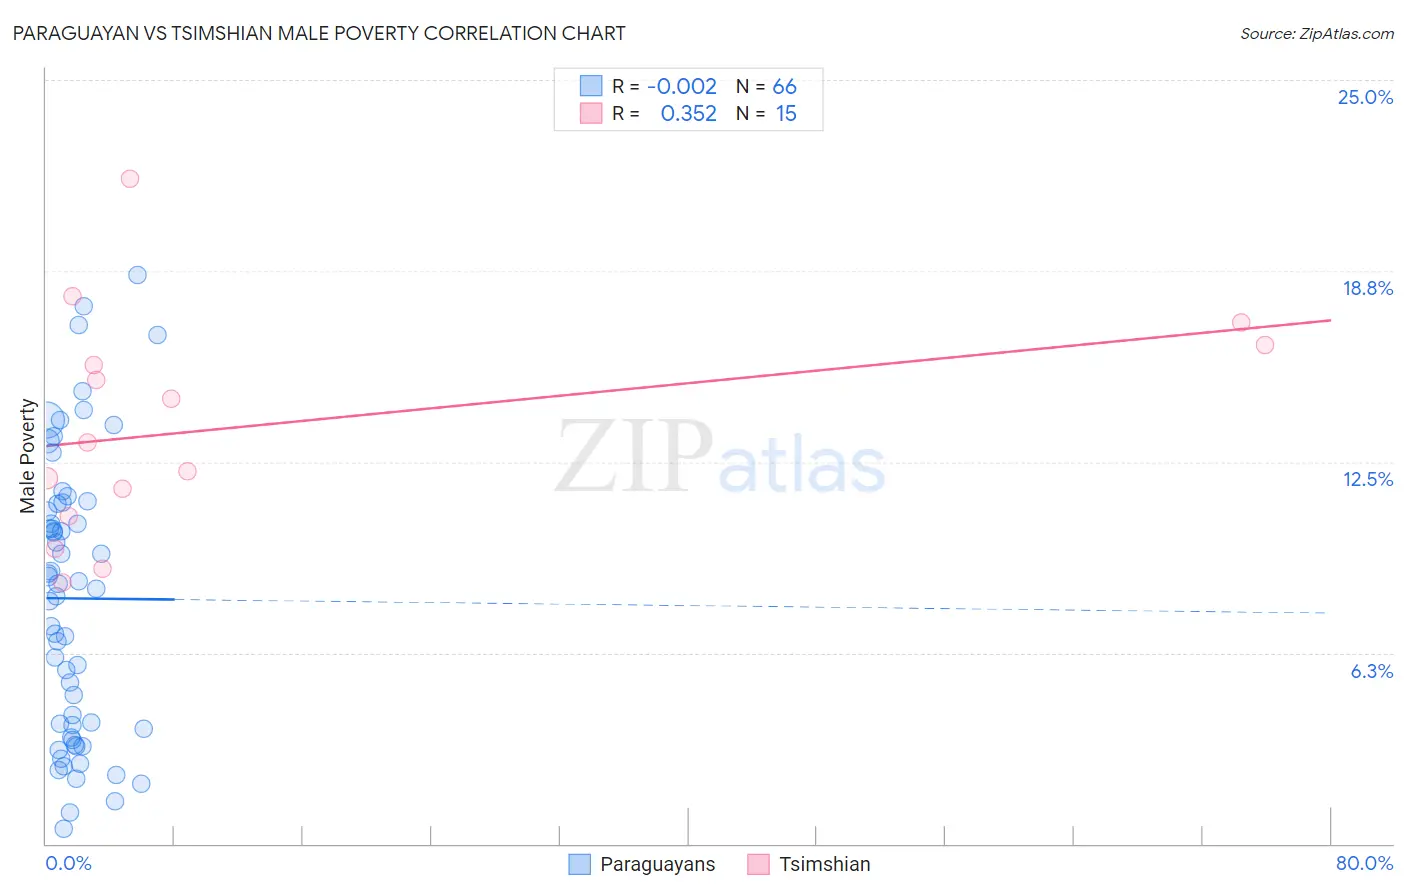
Paraguayan vs Tsimshian Male Poverty Correlation Chart
The statistical analysis conducted on geographies consisting of 95,091,080 people shows no correlation between the proportion of Paraguayans and poverty level among males in the United States with a correlation coefficient (R) of -0.002 and weighted average of 10.2%. Similarly, the statistical analysis conducted on geographies consisting of 15,624,889 people shows a mild positive correlation between the proportion of Tsimshian and poverty level among males in the United States with a correlation coefficient (R) of 0.352 and weighted average of 12.8%, a difference of 25.2%.
Male Poverty Correlation Summary
| Measurement | Paraguayan | Tsimshian |
| Minimum | 0.50% | 8.5% |
| Maximum | 18.6% | 21.8% |
| Range | 18.1% | 13.2% |
| Mean | 8.0% | 13.7% |
| Median | 8.4% | 13.1% |
| Interquartile 25% (IQ1) | 3.8% | 10.7% |
| Interquartile 75% (IQ3) | 11.1% | 16.3% |
| Interquartile Range (IQR) | 7.4% | 5.6% |
| Standard Deviation (Sample) | 4.6% | 3.7% |
| Standard Deviation (Population) | 4.5% | 3.6% |
Similar Demographics by Male Poverty
Demographics Similar to Paraguayans by Male Poverty
In terms of male poverty, the demographic groups most similar to Paraguayans are Immigrants from Australia (10.2%, a difference of 0.020%), European (10.2%, a difference of 0.030%), Immigrants from Canada (10.2%, a difference of 0.030%), Immigrants from Asia (10.2%, a difference of 0.12%), and Immigrants from Sri Lanka (10.2%, a difference of 0.15%).
| Demographics | Rating | Rank | Male Poverty |
| Slovaks | 97.7 /100 | #63 | Exceptional 10.2% |
| Swiss | 97.5 /100 | #64 | Exceptional 10.2% |
| Zimbabweans | 97.5 /100 | #65 | Exceptional 10.2% |
| Serbians | 97.5 /100 | #66 | Exceptional 10.2% |
| Immigrants | Netherlands | 97.3 /100 | #67 | Exceptional 10.2% |
| Immigrants | Sri Lanka | 97.2 /100 | #68 | Exceptional 10.2% |
| Immigrants | Australia | 97.1 /100 | #69 | Exceptional 10.2% |
| Paraguayans | 97.1 /100 | #70 | Exceptional 10.2% |
| Europeans | 97.1 /100 | #71 | Exceptional 10.2% |
| Immigrants | Canada | 97.1 /100 | #72 | Exceptional 10.2% |
| Immigrants | Asia | 97.0 /100 | #73 | Exceptional 10.2% |
| Immigrants | Eastern Europe | 96.9 /100 | #74 | Exceptional 10.2% |
| Carpatho Rusyns | 96.9 /100 | #75 | Exceptional 10.2% |
| Dutch | 96.9 /100 | #76 | Exceptional 10.2% |
| Immigrants | Belgium | 96.8 /100 | #77 | Exceptional 10.3% |
Demographics Similar to Tsimshian by Male Poverty
In terms of male poverty, the demographic groups most similar to Tsimshian are Liberian (12.8%, a difference of 0.010%), Alaskan Athabascan (12.8%, a difference of 0.11%), Nepalese (12.8%, a difference of 0.14%), Sudanese (12.8%, a difference of 0.31%), and Immigrants from El Salvador (12.8%, a difference of 0.32%).
| Demographics | Rating | Rank | Male Poverty |
| French American Indians | 0.4 /100 | #237 | Tragic 12.7% |
| Ecuadorians | 0.4 /100 | #238 | Tragic 12.7% |
| Ghanaians | 0.4 /100 | #239 | Tragic 12.7% |
| Immigrants | Middle Africa | 0.4 /100 | #240 | Tragic 12.7% |
| Sudanese | 0.3 /100 | #241 | Tragic 12.8% |
| Nepalese | 0.3 /100 | #242 | Tragic 12.8% |
| Alaskan Athabascans | 0.3 /100 | #243 | Tragic 12.8% |
| Tsimshian | 0.3 /100 | #244 | Tragic 12.8% |
| Liberians | 0.3 /100 | #245 | Tragic 12.8% |
| Immigrants | El Salvador | 0.2 /100 | #246 | Tragic 12.8% |
| Immigrants | Western Africa | 0.2 /100 | #247 | Tragic 12.9% |
| Immigrants | Sudan | 0.2 /100 | #248 | Tragic 12.9% |
| Potawatomi | 0.2 /100 | #249 | Tragic 12.9% |
| Immigrants | Nicaragua | 0.2 /100 | #250 | Tragic 12.9% |
| Immigrants | Cuba | 0.2 /100 | #251 | Tragic 12.9% |