Paraguayan vs Tsimshian 2 or more Vehicles in Household
COMPARE
Paraguayan
Tsimshian
2 or more Vehicles in Household
2 or more Vehicles in Household Comparison
Paraguayans
Tsimshian
50.3%
2 OR MORE VEHICLES IN HOUSEHOLD
0.0/ 100
METRIC RATING
298th/ 347
METRIC RANK
56.7%
2 OR MORE VEHICLES IN HOUSEHOLD
91.6/ 100
METRIC RATING
125th/ 347
METRIC RANK
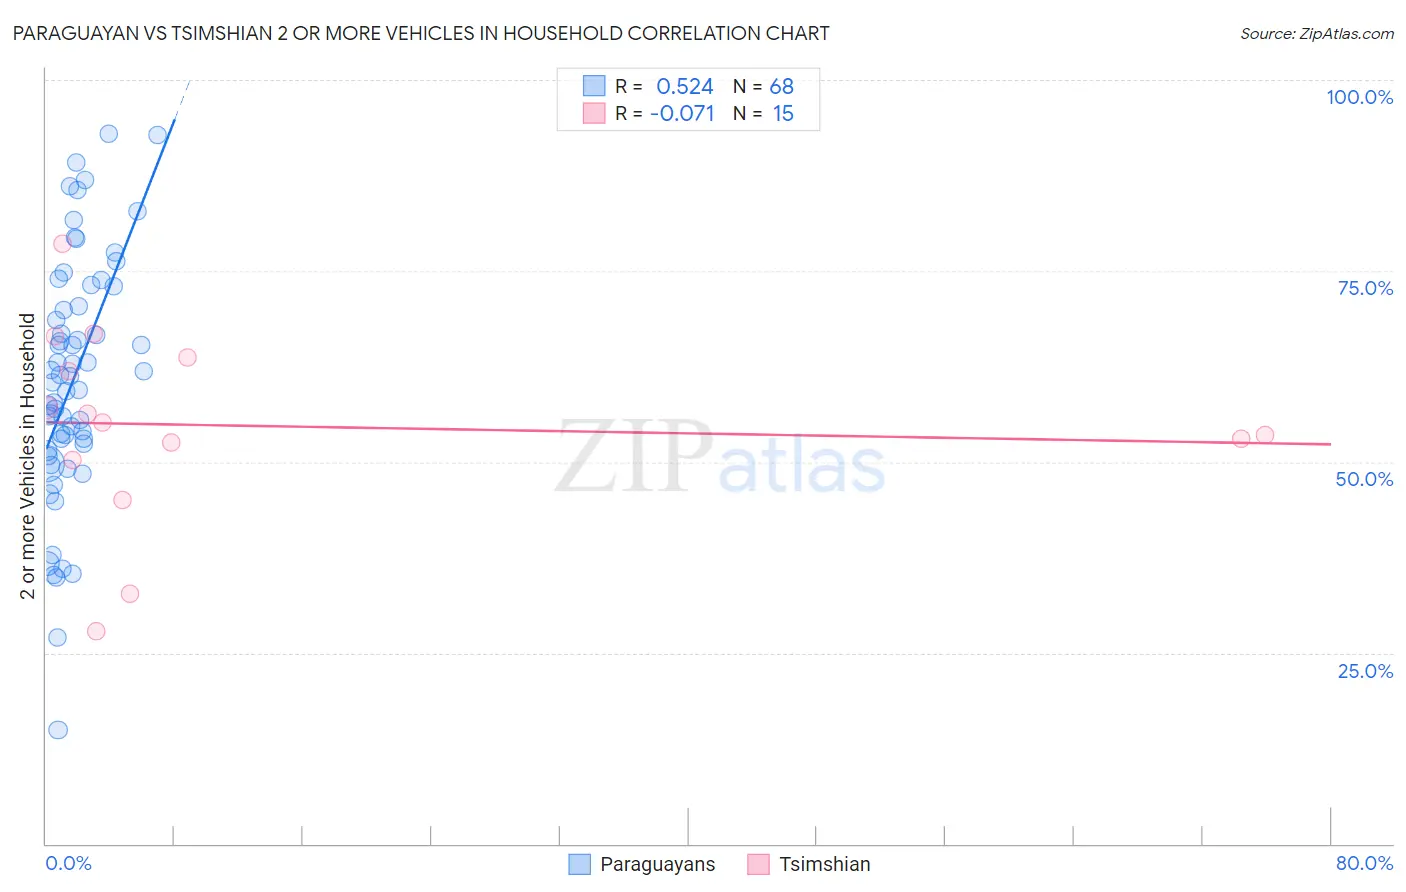
Paraguayan vs Tsimshian 2 or more Vehicles in Household Correlation Chart
The statistical analysis conducted on geographies consisting of 95,096,913 people shows a substantial positive correlation between the proportion of Paraguayans and percentage of households with 2 or more vehicles available in the United States with a correlation coefficient (R) of 0.524 and weighted average of 50.3%. Similarly, the statistical analysis conducted on geographies consisting of 15,626,544 people shows a slight negative correlation between the proportion of Tsimshian and percentage of households with 2 or more vehicles available in the United States with a correlation coefficient (R) of -0.071 and weighted average of 56.7%, a difference of 12.6%.
2 or more Vehicles in Household Correlation Summary
| Measurement | Paraguayan | Tsimshian |
| Minimum | 15.0% | 27.8% |
| Maximum | 93.0% | 78.5% |
| Range | 78.0% | 50.8% |
| Mean | 60.7% | 54.7% |
| Median | 60.8% | 55.1% |
| Interquartile 25% (IQ1) | 52.0% | 50.3% |
| Interquartile 75% (IQ3) | 71.7% | 63.6% |
| Interquartile Range (IQR) | 19.7% | 13.3% |
| Standard Deviation (Sample) | 16.0% | 12.9% |
| Standard Deviation (Population) | 15.8% | 12.4% |
Similar Demographics by 2 or more Vehicles in Household
Demographics Similar to Paraguayans by 2 or more Vehicles in Household
In terms of 2 or more vehicles in household, the demographic groups most similar to Paraguayans are Immigrants from Morocco (50.3%, a difference of 0.030%), Immigrants from Russia (50.3%, a difference of 0.070%), Immigrants from Spain (50.4%, a difference of 0.13%), Immigrants from Greece (50.2%, a difference of 0.25%), and Immigrants from South America (50.2%, a difference of 0.31%).
| Demographics | Rating | Rank | 2 or more Vehicles in Household |
| Belizeans | 0.0 /100 | #291 | Tragic 51.0% |
| Immigrants | Ukraine | 0.0 /100 | #292 | Tragic 50.9% |
| Blacks/African Americans | 0.0 /100 | #293 | Tragic 50.9% |
| Bermudans | 0.0 /100 | #294 | Tragic 50.6% |
| Cypriots | 0.0 /100 | #295 | Tragic 50.6% |
| Immigrants | Somalia | 0.0 /100 | #296 | Tragic 50.5% |
| Immigrants | Spain | 0.0 /100 | #297 | Tragic 50.4% |
| Paraguayans | 0.0 /100 | #298 | Tragic 50.3% |
| Immigrants | Morocco | 0.0 /100 | #299 | Tragic 50.3% |
| Immigrants | Russia | 0.0 /100 | #300 | Tragic 50.3% |
| Immigrants | Greece | 0.0 /100 | #301 | Tragic 50.2% |
| Immigrants | South America | 0.0 /100 | #302 | Tragic 50.2% |
| Tohono O'odham | 0.0 /100 | #303 | Tragic 50.0% |
| Immigrants | Belize | 0.0 /100 | #304 | Tragic 49.9% |
| Immigrants | Western Africa | 0.0 /100 | #305 | Tragic 49.4% |
Demographics Similar to Tsimshian by 2 or more Vehicles in Household
In terms of 2 or more vehicles in household, the demographic groups most similar to Tsimshian are New Zealander (56.7%, a difference of 0.020%), Australian (56.7%, a difference of 0.030%), Estonian (56.6%, a difference of 0.080%), Immigrants from Thailand (56.6%, a difference of 0.11%), and Immigrants from South Africa (56.7%, a difference of 0.12%).
| Demographics | Rating | Rank | 2 or more Vehicles in Household |
| Asians | 95.1 /100 | #118 | Exceptional 57.0% |
| Natives/Alaskans | 95.0 /100 | #119 | Exceptional 57.0% |
| Costa Ricans | 94.7 /100 | #120 | Exceptional 56.9% |
| Sioux | 93.8 /100 | #121 | Exceptional 56.8% |
| Immigrants | South Africa | 92.5 /100 | #122 | Exceptional 56.7% |
| Australians | 91.8 /100 | #123 | Exceptional 56.7% |
| New Zealanders | 91.8 /100 | #124 | Exceptional 56.7% |
| Tsimshian | 91.6 /100 | #125 | Exceptional 56.7% |
| Estonians | 90.9 /100 | #126 | Exceptional 56.6% |
| Immigrants | Thailand | 90.7 /100 | #127 | Exceptional 56.6% |
| Immigrants | South Central Asia | 90.5 /100 | #128 | Exceptional 56.6% |
| Ute | 90.4 /100 | #129 | Exceptional 56.6% |
| Yugoslavians | 90.0 /100 | #130 | Exceptional 56.6% |
| Bulgarians | 89.7 /100 | #131 | Excellent 56.5% |
| Hungarians | 89.1 /100 | #132 | Excellent 56.5% |