Immigrants from Norway vs Tsimshian Wage/Income Gap
COMPARE
Immigrants from Norway
Tsimshian
Wage/Income Gap
Wage/Income Gap Comparison
Immigrants from Norway
Tsimshian
27.3%
WAGE/INCOME GAP
2.5/ 100
METRIC RATING
251st/ 347
METRIC RANK
23.9%
WAGE/INCOME GAP
98.9/ 100
METRIC RATING
103rd/ 347
METRIC RANK
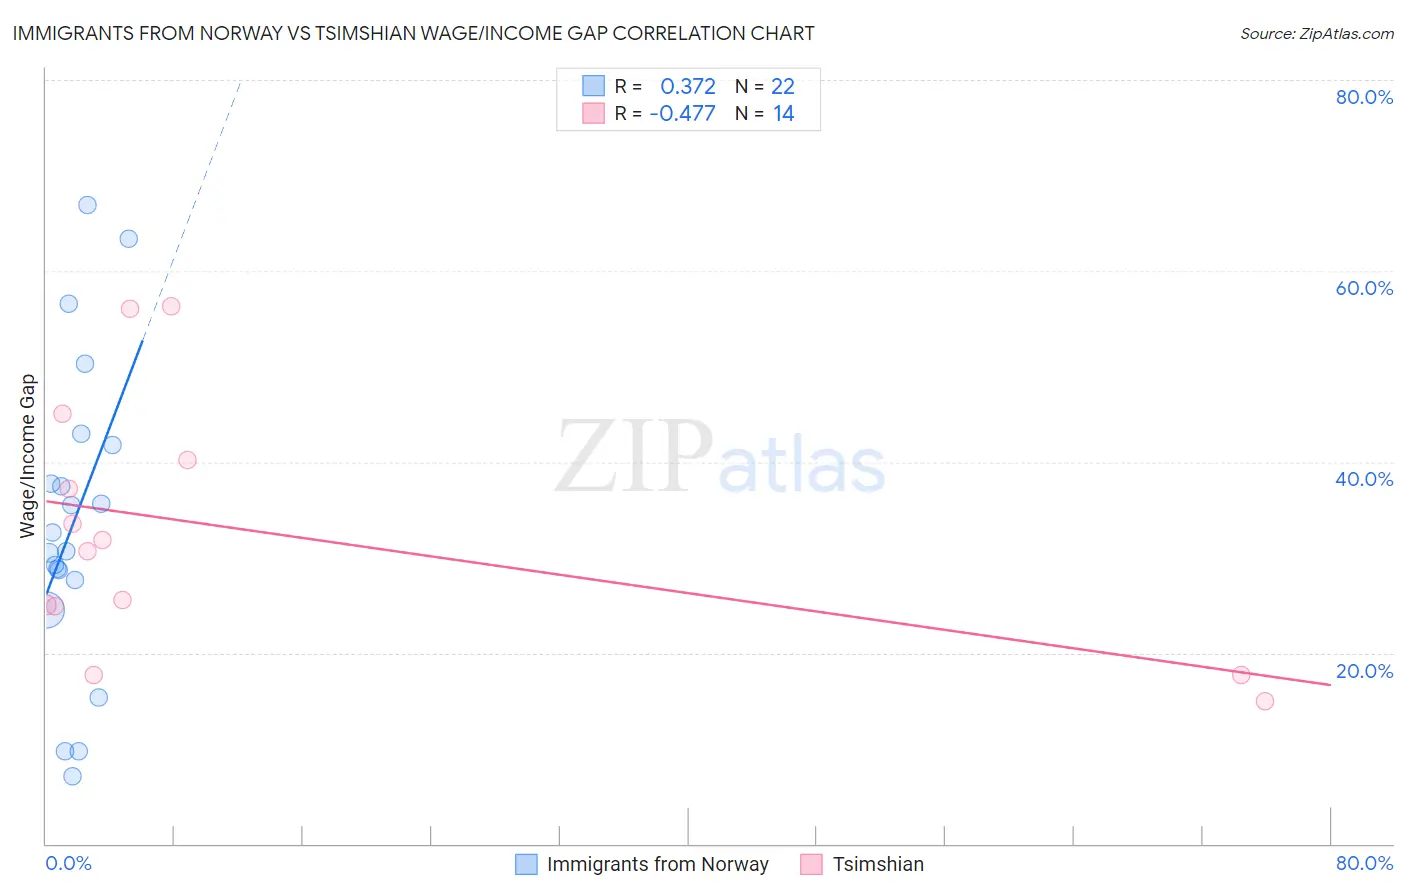
Immigrants from Norway vs Tsimshian Wage/Income Gap Correlation Chart
The statistical analysis conducted on geographies consisting of 116,688,062 people shows a mild positive correlation between the proportion of Immigrants from Norway and wage/income gap percentage in the United States with a correlation coefficient (R) of 0.372 and weighted average of 27.3%. Similarly, the statistical analysis conducted on geographies consisting of 15,623,634 people shows a moderate negative correlation between the proportion of Tsimshian and wage/income gap percentage in the United States with a correlation coefficient (R) of -0.477 and weighted average of 23.9%, a difference of 14.3%.
Wage/Income Gap Correlation Summary
| Measurement | Immigrants from Norway | Tsimshian |
| Minimum | 7.1% | 14.9% |
| Maximum | 66.9% | 56.3% |
| Range | 59.8% | 41.4% |
| Mean | 33.7% | 32.6% |
| Median | 31.6% | 31.2% |
| Interquartile 25% (IQ1) | 27.6% | 24.9% |
| Interquartile 75% (IQ3) | 41.8% | 40.2% |
| Interquartile Range (IQR) | 14.2% | 15.3% |
| Standard Deviation (Sample) | 16.0% | 13.2% |
| Standard Deviation (Population) | 15.6% | 12.7% |
Similar Demographics by Wage/Income Gap
Demographics Similar to Immigrants from Norway by Wage/Income Gap
In terms of wage/income gap, the demographic groups most similar to Immigrants from Norway are Ukrainian (27.3%, a difference of 0.060%), Immigrants from Czechoslovakia (27.3%, a difference of 0.10%), Carpatho Rusyn (27.3%, a difference of 0.12%), Cypriot (27.3%, a difference of 0.13%), and Celtic (27.3%, a difference of 0.14%).
| Demographics | Rating | Rank | Wage/Income Gap |
| Chickasaw | 3.5 /100 | #244 | Tragic 27.2% |
| Immigrants | Azores | 3.5 /100 | #245 | Tragic 27.2% |
| Immigrants | Nonimmigrants | 3.3 /100 | #246 | Tragic 27.2% |
| Celtics | 2.8 /100 | #247 | Tragic 27.3% |
| Cypriots | 2.8 /100 | #248 | Tragic 27.3% |
| Carpatho Rusyns | 2.7 /100 | #249 | Tragic 27.3% |
| Immigrants | Czechoslovakia | 2.7 /100 | #250 | Tragic 27.3% |
| Immigrants | Norway | 2.5 /100 | #251 | Tragic 27.3% |
| Ukrainians | 2.4 /100 | #252 | Tragic 27.3% |
| Portuguese | 2.2 /100 | #253 | Tragic 27.4% |
| Israelis | 2.1 /100 | #254 | Tragic 27.4% |
| Immigrants | France | 2.1 /100 | #255 | Tragic 27.4% |
| Cherokee | 1.9 /100 | #256 | Tragic 27.4% |
| Luxembourgers | 1.9 /100 | #257 | Tragic 27.4% |
| Slavs | 1.8 /100 | #258 | Tragic 27.4% |
Demographics Similar to Tsimshian by Wage/Income Gap
In terms of wage/income gap, the demographic groups most similar to Tsimshian are Immigrants from Laos (23.8%, a difference of 0.23%), Tlingit-Haida (24.0%, a difference of 0.33%), Japanese (23.8%, a difference of 0.37%), Moroccan (24.0%, a difference of 0.39%), and Sudanese (24.0%, a difference of 0.39%).
| Demographics | Rating | Rank | Wage/Income Gap |
| Kiowa | 99.4 /100 | #96 | Exceptional 23.6% |
| Immigrants | Sudan | 99.4 /100 | #97 | Exceptional 23.6% |
| Immigrants | Latin America | 99.2 /100 | #98 | Exceptional 23.7% |
| Aleuts | 99.2 /100 | #99 | Exceptional 23.7% |
| Yakama | 99.2 /100 | #100 | Exceptional 23.7% |
| Japanese | 99.1 /100 | #101 | Exceptional 23.8% |
| Immigrants | Laos | 99.0 /100 | #102 | Exceptional 23.8% |
| Tsimshian | 98.9 /100 | #103 | Exceptional 23.9% |
| Tlingit-Haida | 98.7 /100 | #104 | Exceptional 24.0% |
| Moroccans | 98.6 /100 | #105 | Exceptional 24.0% |
| Sudanese | 98.6 /100 | #106 | Exceptional 24.0% |
| Yaqui | 98.4 /100 | #107 | Exceptional 24.0% |
| Immigrants | Albania | 98.4 /100 | #108 | Exceptional 24.0% |
| Ugandans | 98.3 /100 | #109 | Exceptional 24.1% |
| Immigrants | Morocco | 98.1 /100 | #110 | Exceptional 24.1% |