Paraguayan vs Tsimshian 8th Grade
COMPARE
Paraguayan
Tsimshian
8th Grade
8th Grade Comparison
Paraguayans
Tsimshian
95.5%
8TH GRADE
22.6/ 100
METRIC RATING
198th/ 347
METRIC RANK
99.0%
8TH GRADE
100.0/ 100
METRIC RATING
2nd/ 347
METRIC RANK
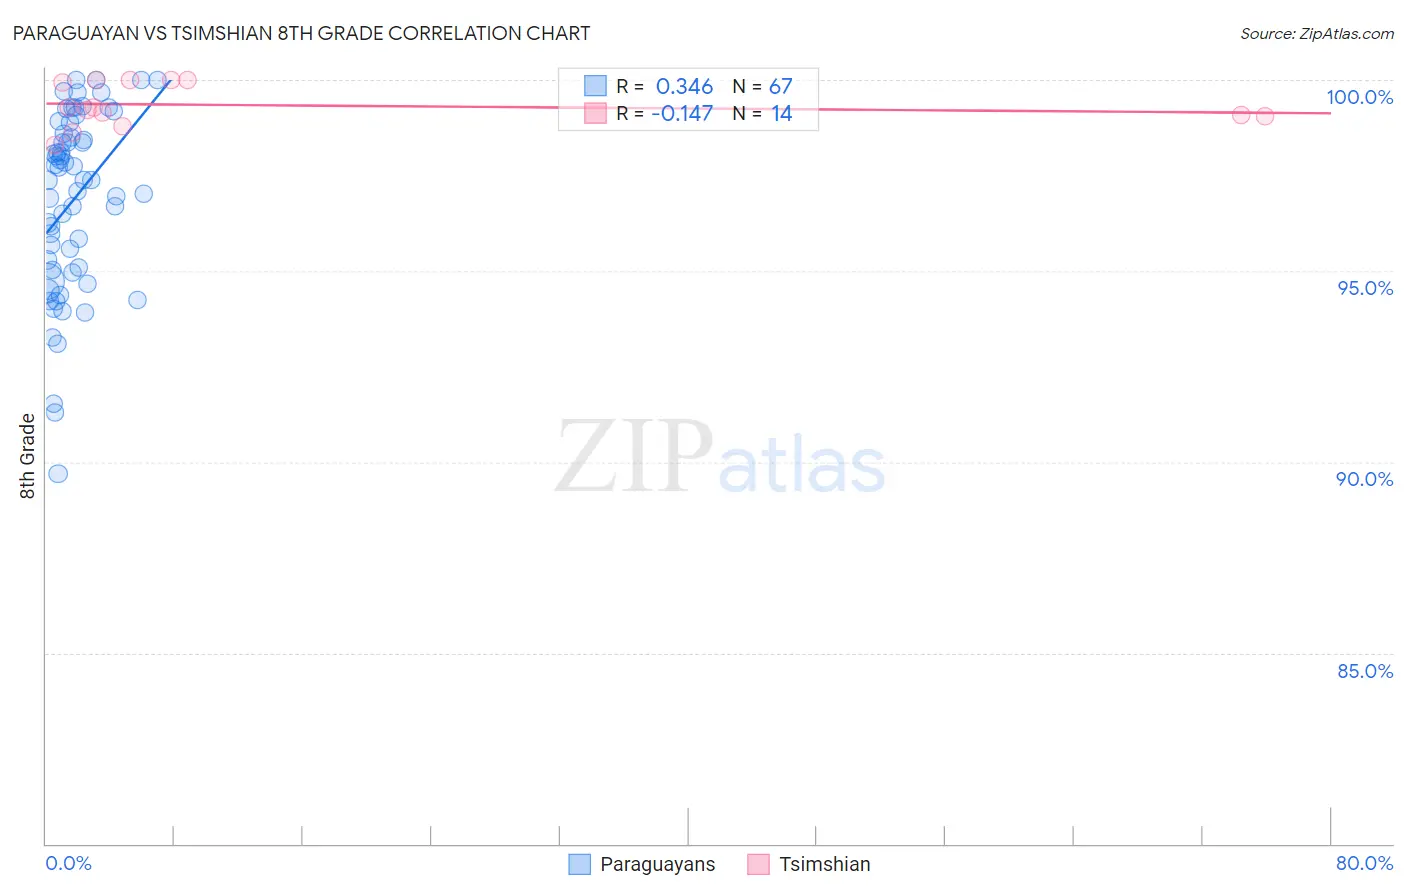
Paraguayan vs Tsimshian 8th Grade Correlation Chart
The statistical analysis conducted on geographies consisting of 95,113,577 people shows a mild positive correlation between the proportion of Paraguayans and percentage of population with at least 8th grade education in the United States with a correlation coefficient (R) of 0.346 and weighted average of 95.5%. Similarly, the statistical analysis conducted on geographies consisting of 221,806 people shows a poor negative correlation between the proportion of Tsimshian and percentage of population with at least 8th grade education in the United States with a correlation coefficient (R) of -0.147 and weighted average of 99.0%, a difference of 3.6%.
8th Grade Correlation Summary
| Measurement | Paraguayan | Tsimshian |
| Minimum | 89.7% | 98.3% |
| Maximum | 100.0% | 100.0% |
| Range | 10.3% | 1.7% |
| Mean | 96.8% | 99.3% |
| Median | 97.4% | 99.2% |
| Interquartile 25% (IQ1) | 95.0% | 99.1% |
| Interquartile 75% (IQ3) | 98.6% | 100.0% |
| Interquartile Range (IQR) | 3.6% | 0.93% |
| Standard Deviation (Sample) | 2.3% | 0.57% |
| Standard Deviation (Population) | 2.3% | 0.55% |
Similar Demographics by 8th Grade
Demographics Similar to Paraguayans by 8th Grade
In terms of 8th grade, the demographic groups most similar to Paraguayans are Immigrants from Northern Africa (95.5%, a difference of 0.0%), Argentinean (95.5%, a difference of 0.0%), Immigrants from Zaire (95.6%, a difference of 0.020%), Assyrian/Chaldean/Syriac (95.6%, a difference of 0.020%), and Sierra Leonean (95.6%, a difference of 0.020%).
| Demographics | Rating | Rank | 8th Grade |
| Immigrants | Nepal | 30.2 /100 | #191 | Fair 95.6% |
| Pima | 28.6 /100 | #192 | Fair 95.6% |
| Panamanians | 28.4 /100 | #193 | Fair 95.6% |
| Guamanians/Chamorros | 26.6 /100 | #194 | Fair 95.6% |
| Immigrants | Zaire | 25.2 /100 | #195 | Fair 95.6% |
| Assyrians/Chaldeans/Syriacs | 24.5 /100 | #196 | Fair 95.6% |
| Sierra Leoneans | 24.3 /100 | #197 | Fair 95.6% |
| Paraguayans | 22.6 /100 | #198 | Fair 95.5% |
| Immigrants | Northern Africa | 22.5 /100 | #199 | Fair 95.5% |
| Argentineans | 22.2 /100 | #200 | Fair 95.5% |
| Immigrants | Argentina | 20.6 /100 | #201 | Fair 95.5% |
| Apache | 19.4 /100 | #202 | Poor 95.5% |
| Moroccans | 17.4 /100 | #203 | Poor 95.5% |
| Hawaiians | 16.7 /100 | #204 | Poor 95.5% |
| Immigrants | Bahamas | 16.7 /100 | #205 | Poor 95.5% |
Demographics Similar to Tsimshian by 8th Grade
In terms of 8th grade, the demographic groups most similar to Tsimshian are Crow (99.0%, a difference of 0.090%), Finnish (98.4%, a difference of 0.60%), Carpatho Rusyn (98.1%, a difference of 0.83%), Ottawa (97.9%, a difference of 1.0%), and Dutch (97.7%, a difference of 1.3%).
| Demographics | Rating | Rank | 8th Grade |
| Crow | 100.0 /100 | #1 | Exceptional 99.0% |
| Tsimshian | 100.0 /100 | #2 | Exceptional 99.0% |
| Finns | 100.0 /100 | #3 | Exceptional 98.4% |
| Carpatho Rusyns | 100.0 /100 | #4 | Exceptional 98.1% |
| Ottawa | 100.0 /100 | #5 | Exceptional 97.9% |
| Dutch | 100.0 /100 | #6 | Exceptional 97.7% |
| Norwegians | 100.0 /100 | #7 | Exceptional 97.6% |
| Slovaks | 100.0 /100 | #8 | Exceptional 97.6% |
| Germans | 100.0 /100 | #9 | Exceptional 97.5% |
| Slovenes | 100.0 /100 | #10 | Exceptional 97.5% |
| Poles | 100.0 /100 | #11 | Exceptional 97.4% |
| Swedes | 100.0 /100 | #12 | Exceptional 97.4% |
| Alaskan Athabascans | 100.0 /100 | #13 | Exceptional 97.3% |
| English | 100.0 /100 | #14 | Exceptional 97.3% |
| Pennsylvania Germans | 100.0 /100 | #15 | Exceptional 97.3% |