Osage vs Vietnamese Wage/Income Gap
COMPARE
Osage
Vietnamese
Wage/Income Gap
Wage/Income Gap Comparison
Osage
Vietnamese
27.1%
WAGE/INCOME GAP
4.4/ 100
METRIC RATING
238th/ 347
METRIC RANK
21.0%
WAGE/INCOME GAP
100.0/ 100
METRIC RATING
31st/ 347
METRIC RANK
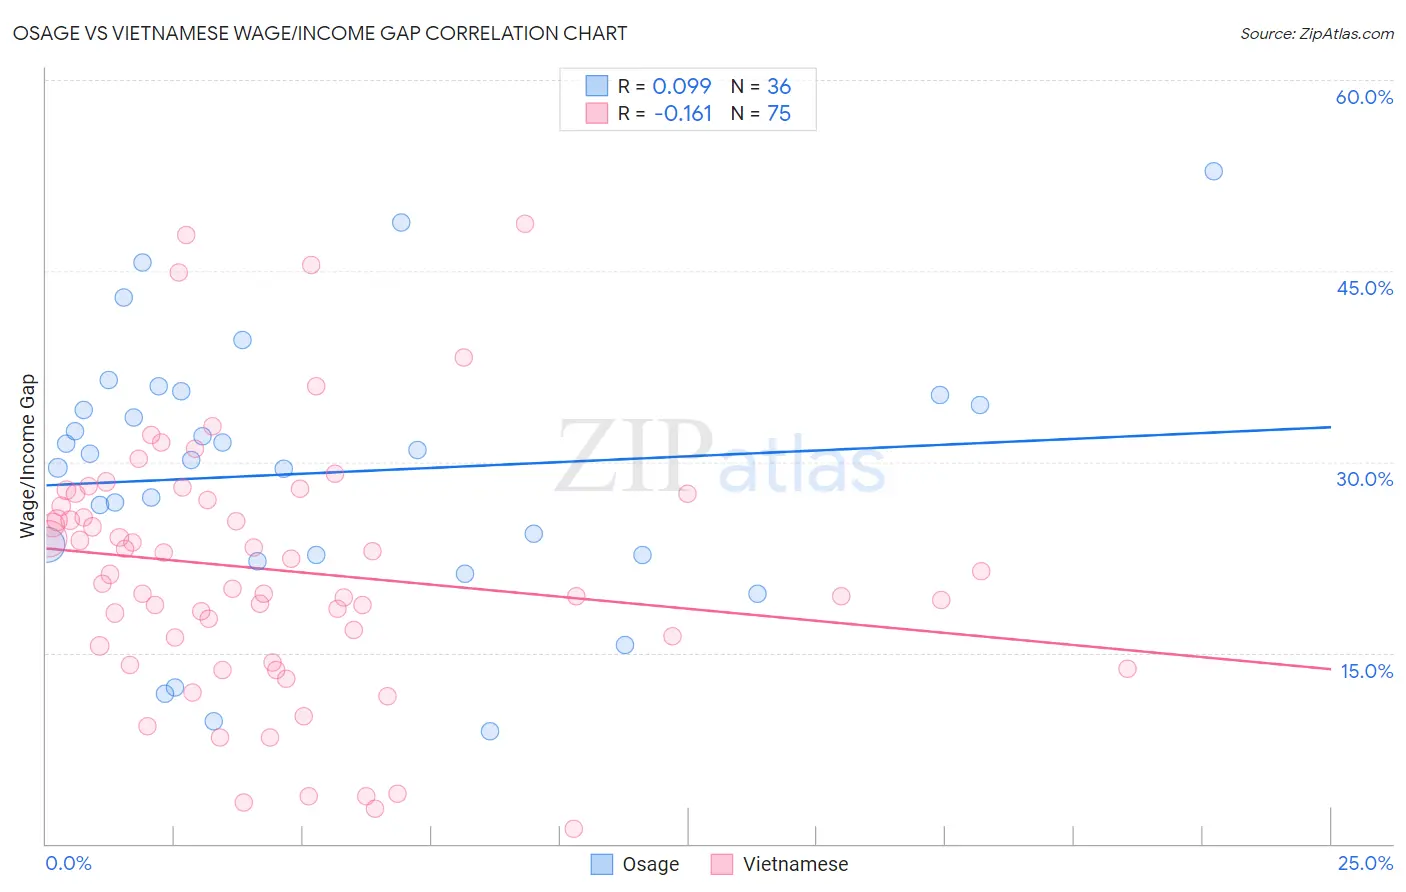
Osage vs Vietnamese Wage/Income Gap Correlation Chart
The statistical analysis conducted on geographies consisting of 91,772,804 people shows a slight positive correlation between the proportion of Osage and wage/income gap percentage in the United States with a correlation coefficient (R) of 0.099 and weighted average of 27.1%. Similarly, the statistical analysis conducted on geographies consisting of 170,722,757 people shows a poor negative correlation between the proportion of Vietnamese and wage/income gap percentage in the United States with a correlation coefficient (R) of -0.161 and weighted average of 21.0%, a difference of 28.9%.
Wage/Income Gap Correlation Summary
| Measurement | Osage | Vietnamese |
| Minimum | 8.8% | 1.1% |
| Maximum | 52.9% | 48.7% |
| Range | 44.1% | 47.5% |
| Mean | 29.1% | 21.5% |
| Median | 30.4% | 21.2% |
| Interquartile 25% (IQ1) | 22.6% | 15.6% |
| Interquartile 75% (IQ3) | 34.9% | 27.5% |
| Interquartile Range (IQR) | 12.2% | 11.9% |
| Standard Deviation (Sample) | 10.3% | 10.1% |
| Standard Deviation (Population) | 10.2% | 10.0% |
Similar Demographics by Wage/Income Gap
Demographics Similar to Osage by Wage/Income Gap
In terms of wage/income gap, the demographic groups most similar to Osage are Immigrants from Eastern Asia (27.1%, a difference of 0.0%), Estonian (27.1%, a difference of 0.020%), Immigrants from Romania (27.0%, a difference of 0.15%), Immigrants from Hungary (27.0%, a difference of 0.16%), and Immigrants from Pakistan (27.0%, a difference of 0.18%).
| Demographics | Rating | Rank | Wage/Income Gap |
| Bhutanese | 5.3 /100 | #231 | Tragic 27.0% |
| Argentineans | 5.2 /100 | #232 | Tragic 27.0% |
| Immigrants | Brazil | 5.0 /100 | #233 | Tragic 27.0% |
| Immigrants | Pakistan | 4.9 /100 | #234 | Tragic 27.0% |
| Immigrants | Hungary | 4.8 /100 | #235 | Tragic 27.0% |
| Immigrants | Romania | 4.8 /100 | #236 | Tragic 27.0% |
| Immigrants | Eastern Asia | 4.4 /100 | #237 | Tragic 27.1% |
| Osage | 4.4 /100 | #238 | Tragic 27.1% |
| Estonians | 4.3 /100 | #239 | Tragic 27.1% |
| Immigrants | Europe | 3.8 /100 | #240 | Tragic 27.1% |
| Creek | 3.8 /100 | #241 | Tragic 27.1% |
| Immigrants | Sri Lanka | 3.7 /100 | #242 | Tragic 27.1% |
| Spanish | 3.6 /100 | #243 | Tragic 27.1% |
| Chickasaw | 3.5 /100 | #244 | Tragic 27.2% |
| Immigrants | Azores | 3.5 /100 | #245 | Tragic 27.2% |
Demographics Similar to Vietnamese by Wage/Income Gap
In terms of wage/income gap, the demographic groups most similar to Vietnamese are Immigrants from Yemen (21.1%, a difference of 0.23%), Immigrants from Bahamas (21.1%, a difference of 0.25%), Immigrants from Bangladesh (20.9%, a difference of 0.28%), Immigrants from Senegal (20.9%, a difference of 0.49%), and Pima (21.1%, a difference of 0.53%).
| Demographics | Rating | Rank | Wage/Income Gap |
| Dominicans | 100.0 /100 | #24 | Exceptional 20.6% |
| Senegalese | 100.0 /100 | #25 | Exceptional 20.7% |
| Pueblo | 100.0 /100 | #26 | Exceptional 20.7% |
| Immigrants | Armenia | 100.0 /100 | #27 | Exceptional 20.7% |
| Inupiat | 100.0 /100 | #28 | Exceptional 20.8% |
| Immigrants | Senegal | 100.0 /100 | #29 | Exceptional 20.9% |
| Immigrants | Bangladesh | 100.0 /100 | #30 | Exceptional 20.9% |
| Vietnamese | 100.0 /100 | #31 | Exceptional 21.0% |
| Immigrants | Yemen | 100.0 /100 | #32 | Exceptional 21.1% |
| Immigrants | Bahamas | 100.0 /100 | #33 | Exceptional 21.1% |
| Pima | 100.0 /100 | #34 | Exceptional 21.1% |
| Somalis | 100.0 /100 | #35 | Exceptional 21.2% |
| Belizeans | 100.0 /100 | #36 | Exceptional 21.2% |
| Immigrants | Somalia | 100.0 /100 | #37 | Exceptional 21.2% |
| Immigrants | Belize | 100.0 /100 | #38 | Exceptional 21.3% |