Osage vs Immigrants from Lithuania Wage/Income Gap
COMPARE
Osage
Immigrants from Lithuania
Wage/Income Gap
Wage/Income Gap Comparison
Osage
Immigrants from Lithuania
27.1%
WAGE/INCOME GAP
4.4/ 100
METRIC RATING
238th/ 347
METRIC RANK
28.6%
WAGE/INCOME GAP
0.1/ 100
METRIC RATING
311th/ 347
METRIC RANK
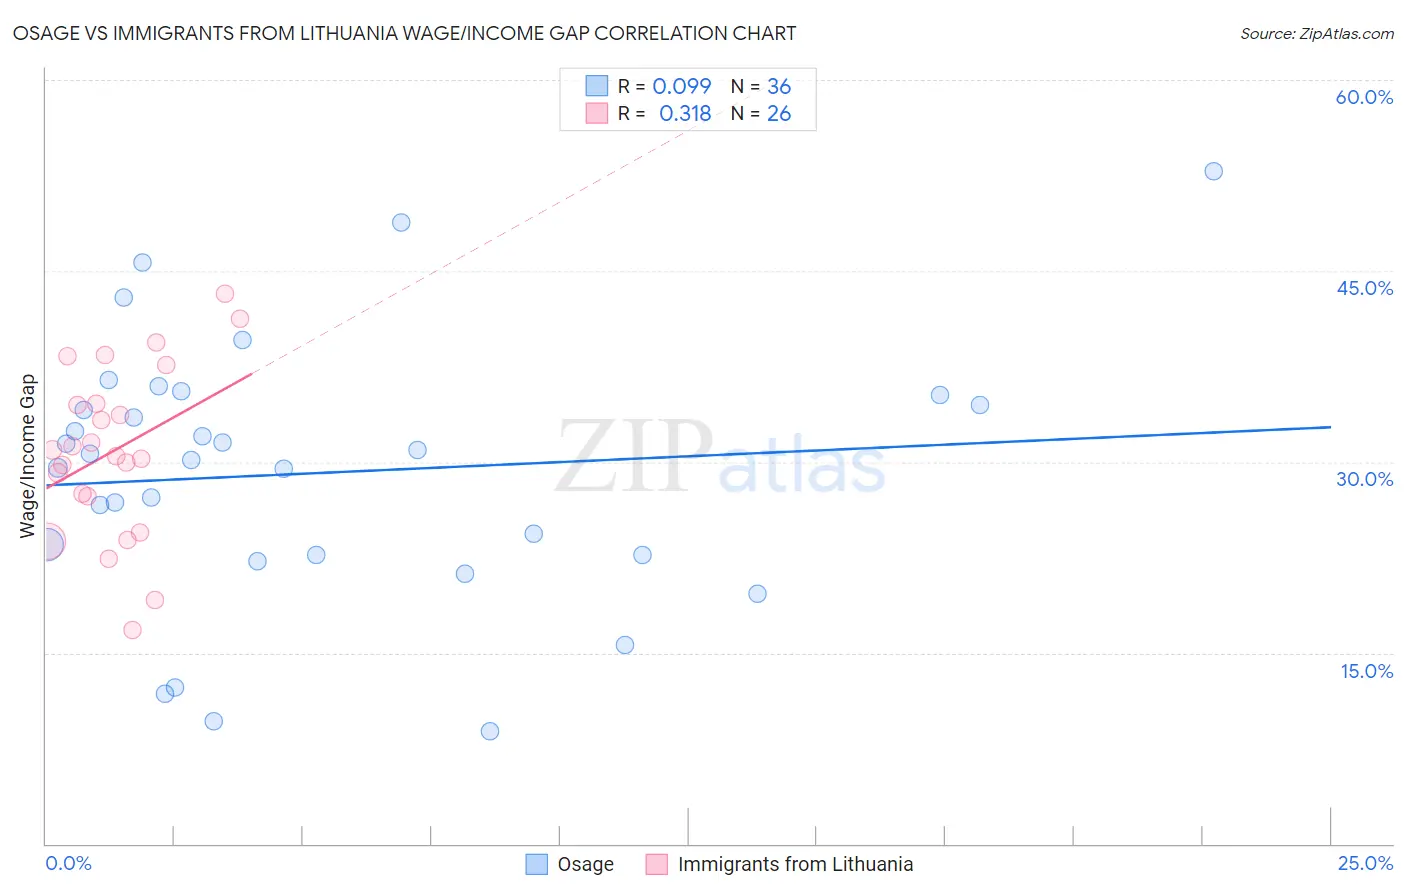
Osage vs Immigrants from Lithuania Wage/Income Gap Correlation Chart
The statistical analysis conducted on geographies consisting of 91,772,804 people shows a slight positive correlation between the proportion of Osage and wage/income gap percentage in the United States with a correlation coefficient (R) of 0.099 and weighted average of 27.1%. Similarly, the statistical analysis conducted on geographies consisting of 117,698,624 people shows a mild positive correlation between the proportion of Immigrants from Lithuania and wage/income gap percentage in the United States with a correlation coefficient (R) of 0.318 and weighted average of 28.6%, a difference of 5.7%.
Wage/Income Gap Correlation Summary
| Measurement | Osage | Immigrants from Lithuania |
| Minimum | 8.8% | 16.8% |
| Maximum | 52.9% | 43.2% |
| Range | 44.1% | 26.5% |
| Mean | 29.1% | 30.9% |
| Median | 30.4% | 30.7% |
| Interquartile 25% (IQ1) | 22.6% | 27.3% |
| Interquartile 75% (IQ3) | 34.9% | 34.5% |
| Interquartile Range (IQR) | 12.2% | 7.3% |
| Standard Deviation (Sample) | 10.3% | 6.7% |
| Standard Deviation (Population) | 10.2% | 6.5% |
Similar Demographics by Wage/Income Gap
Demographics Similar to Osage by Wage/Income Gap
In terms of wage/income gap, the demographic groups most similar to Osage are Immigrants from Eastern Asia (27.1%, a difference of 0.0%), Estonian (27.1%, a difference of 0.020%), Immigrants from Romania (27.0%, a difference of 0.15%), Immigrants from Hungary (27.0%, a difference of 0.16%), and Immigrants from Pakistan (27.0%, a difference of 0.18%).
| Demographics | Rating | Rank | Wage/Income Gap |
| Bhutanese | 5.3 /100 | #231 | Tragic 27.0% |
| Argentineans | 5.2 /100 | #232 | Tragic 27.0% |
| Immigrants | Brazil | 5.0 /100 | #233 | Tragic 27.0% |
| Immigrants | Pakistan | 4.9 /100 | #234 | Tragic 27.0% |
| Immigrants | Hungary | 4.8 /100 | #235 | Tragic 27.0% |
| Immigrants | Romania | 4.8 /100 | #236 | Tragic 27.0% |
| Immigrants | Eastern Asia | 4.4 /100 | #237 | Tragic 27.1% |
| Osage | 4.4 /100 | #238 | Tragic 27.1% |
| Estonians | 4.3 /100 | #239 | Tragic 27.1% |
| Immigrants | Europe | 3.8 /100 | #240 | Tragic 27.1% |
| Creek | 3.8 /100 | #241 | Tragic 27.1% |
| Immigrants | Sri Lanka | 3.7 /100 | #242 | Tragic 27.1% |
| Spanish | 3.6 /100 | #243 | Tragic 27.1% |
| Chickasaw | 3.5 /100 | #244 | Tragic 27.2% |
| Immigrants | Azores | 3.5 /100 | #245 | Tragic 27.2% |
Demographics Similar to Immigrants from Lithuania by Wage/Income Gap
In terms of wage/income gap, the demographic groups most similar to Immigrants from Lithuania are Finnish (28.6%, a difference of 0.070%), Eastern European (28.6%, a difference of 0.13%), Macedonian (28.6%, a difference of 0.16%), Polish (28.5%, a difference of 0.25%), and French (28.7%, a difference of 0.26%).
| Demographics | Rating | Rank | Wage/Income Gap |
| Immigrants | Netherlands | 0.2 /100 | #304 | Tragic 28.5% |
| Immigrants | South Africa | 0.1 /100 | #305 | Tragic 28.5% |
| Whites/Caucasians | 0.1 /100 | #306 | Tragic 28.5% |
| Immigrants | Denmark | 0.1 /100 | #307 | Tragic 28.5% |
| Poles | 0.1 /100 | #308 | Tragic 28.5% |
| Macedonians | 0.1 /100 | #309 | Tragic 28.6% |
| Finns | 0.1 /100 | #310 | Tragic 28.6% |
| Immigrants | Lithuania | 0.1 /100 | #311 | Tragic 28.6% |
| Eastern Europeans | 0.1 /100 | #312 | Tragic 28.6% |
| French | 0.1 /100 | #313 | Tragic 28.7% |
| Immigrants | Scotland | 0.1 /100 | #314 | Tragic 28.7% |
| Maltese | 0.1 /100 | #315 | Tragic 28.7% |
| Lithuanians | 0.1 /100 | #316 | Tragic 28.7% |
| Belgians | 0.1 /100 | #317 | Tragic 28.8% |
| Basques | 0.1 /100 | #318 | Tragic 28.8% |