Osage vs Immigrants from Western Africa Per Capita Income
COMPARE
Osage
Immigrants from Western Africa
Per Capita Income
Per Capita Income Comparison
Osage
Immigrants from Western Africa
$39,568
PER CAPITA INCOME
1.0/ 100
METRIC RATING
253rd/ 347
METRIC RANK
$40,294
PER CAPITA INCOME
2.2/ 100
METRIC RATING
242nd/ 347
METRIC RANK
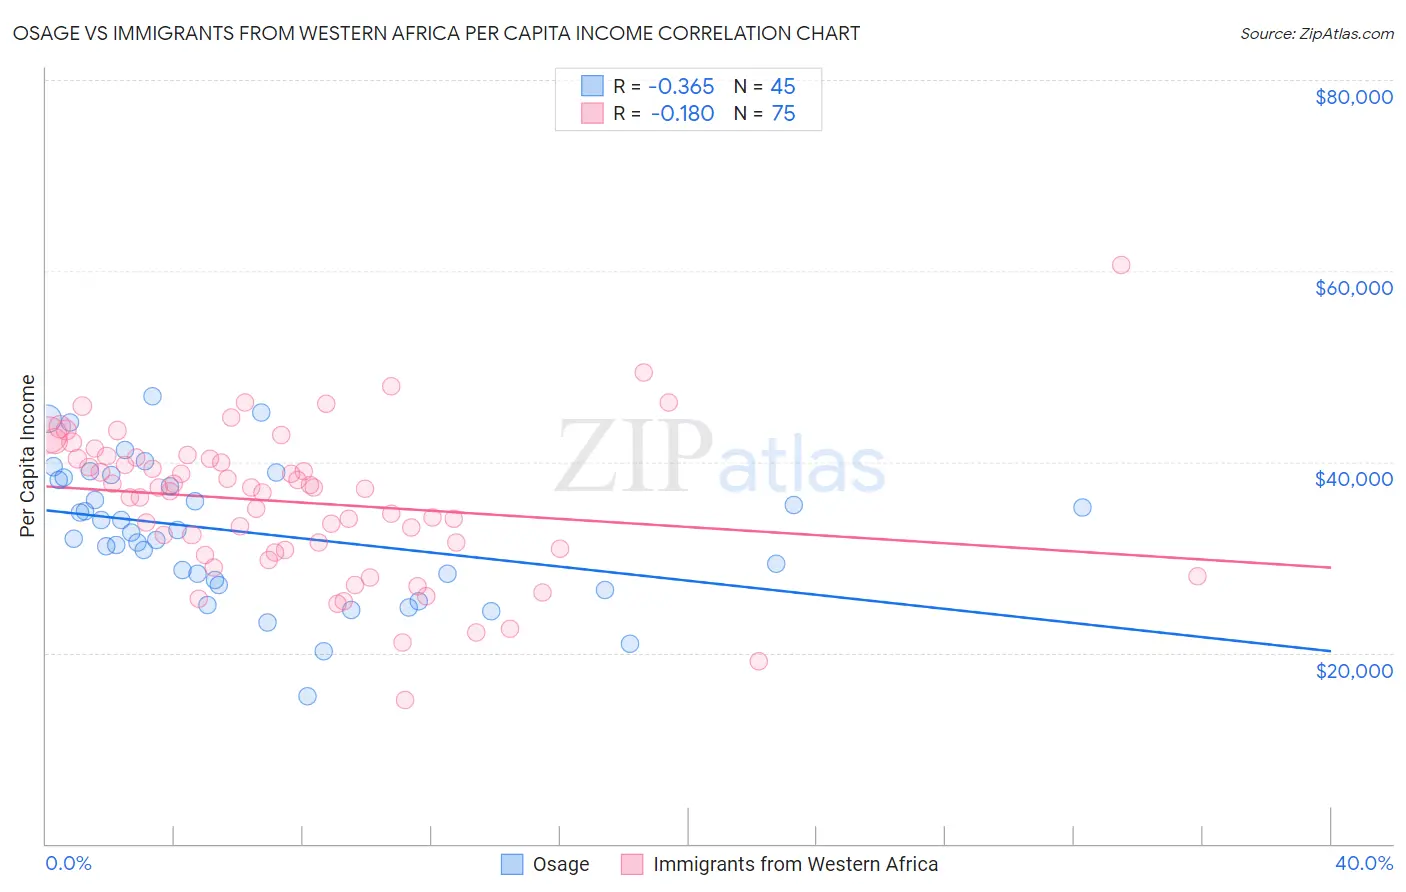
Osage vs Immigrants from Western Africa Per Capita Income Correlation Chart
The statistical analysis conducted on geographies consisting of 91,808,929 people shows a mild negative correlation between the proportion of Osage and per capita income in the United States with a correlation coefficient (R) of -0.365 and weighted average of $39,568. Similarly, the statistical analysis conducted on geographies consisting of 357,903,871 people shows a poor negative correlation between the proportion of Immigrants from Western Africa and per capita income in the United States with a correlation coefficient (R) of -0.180 and weighted average of $40,294, a difference of 1.8%.
Per Capita Income Correlation Summary
| Measurement | Osage | Immigrants from Western Africa |
| Minimum | $15,396 | $15,041 |
| Maximum | $46,906 | $60,586 |
| Range | $31,510 | $45,545 |
| Mean | $32,578 | $35,763 |
| Median | $32,608 | $37,211 |
| Interquartile 25% (IQ1) | $27,395 | $30,829 |
| Interquartile 75% (IQ3) | $38,257 | $40,508 |
| Interquartile Range (IQR) | $10,862 | $9,679 |
| Standard Deviation (Sample) | $7,093 | $7,739 |
| Standard Deviation (Population) | $7,014 | $7,688 |
Demographics Similar to Osage and Immigrants from Western Africa by Per Capita Income
In terms of per capita income, the demographic groups most similar to Osage are Alaska Native ($39,558, a difference of 0.020%), Immigrants from the Azores ($39,608, a difference of 0.10%), Immigrants from Middle Africa ($39,529, a difference of 0.10%), Hawaiian ($39,403, a difference of 0.42%), and Nicaraguan ($39,372, a difference of 0.50%). Similarly, the demographic groups most similar to Immigrants from Western Africa are German Russian ($40,266, a difference of 0.070%), British West Indian ($40,330, a difference of 0.090%), Immigrants from Nigeria ($40,339, a difference of 0.11%), Tsimshian ($40,344, a difference of 0.12%), and French American Indian ($40,244, a difference of 0.13%).
| Demographics | Rating | Rank | Per Capita Income |
| Immigrants | Cambodia | 2.6 /100 | #237 | Tragic $40,434 |
| Somalis | 2.4 /100 | #238 | Tragic $40,367 |
| Tsimshian | 2.4 /100 | #239 | Tragic $40,344 |
| Immigrants | Nigeria | 2.3 /100 | #240 | Tragic $40,339 |
| British West Indians | 2.3 /100 | #241 | Tragic $40,330 |
| Immigrants | Western Africa | 2.2 /100 | #242 | Tragic $40,294 |
| German Russians | 2.2 /100 | #243 | Tragic $40,266 |
| French American Indians | 2.1 /100 | #244 | Tragic $40,244 |
| Sub-Saharan Africans | 1.9 /100 | #245 | Tragic $40,152 |
| Cree | 1.7 /100 | #246 | Tragic $40,056 |
| Immigrants | Somalia | 1.6 /100 | #247 | Tragic $39,974 |
| Cape Verdeans | 1.5 /100 | #248 | Tragic $39,935 |
| Japanese | 1.4 /100 | #249 | Tragic $39,870 |
| Immigrants | Burma/Myanmar | 1.3 /100 | #250 | Tragic $39,827 |
| Samoans | 1.3 /100 | #251 | Tragic $39,826 |
| Immigrants | Azores | 1.0 /100 | #252 | Tragic $39,608 |
| Osage | 1.0 /100 | #253 | Tragic $39,568 |
| Alaska Natives | 1.0 /100 | #254 | Tragic $39,558 |
| Immigrants | Middle Africa | 1.0 /100 | #255 | Tragic $39,529 |
| Hawaiians | 0.8 /100 | #256 | Tragic $39,403 |
| Nicaraguans | 0.8 /100 | #257 | Tragic $39,372 |