Osage vs Russian Per Capita Income
COMPARE
Osage
Russian
Per Capita Income
Per Capita Income Comparison
Osage
Russians
$39,568
PER CAPITA INCOME
1.0/ 100
METRIC RATING
253rd/ 347
METRIC RANK
$53,154
PER CAPITA INCOME
100.0/ 100
METRIC RATING
26th/ 347
METRIC RANK
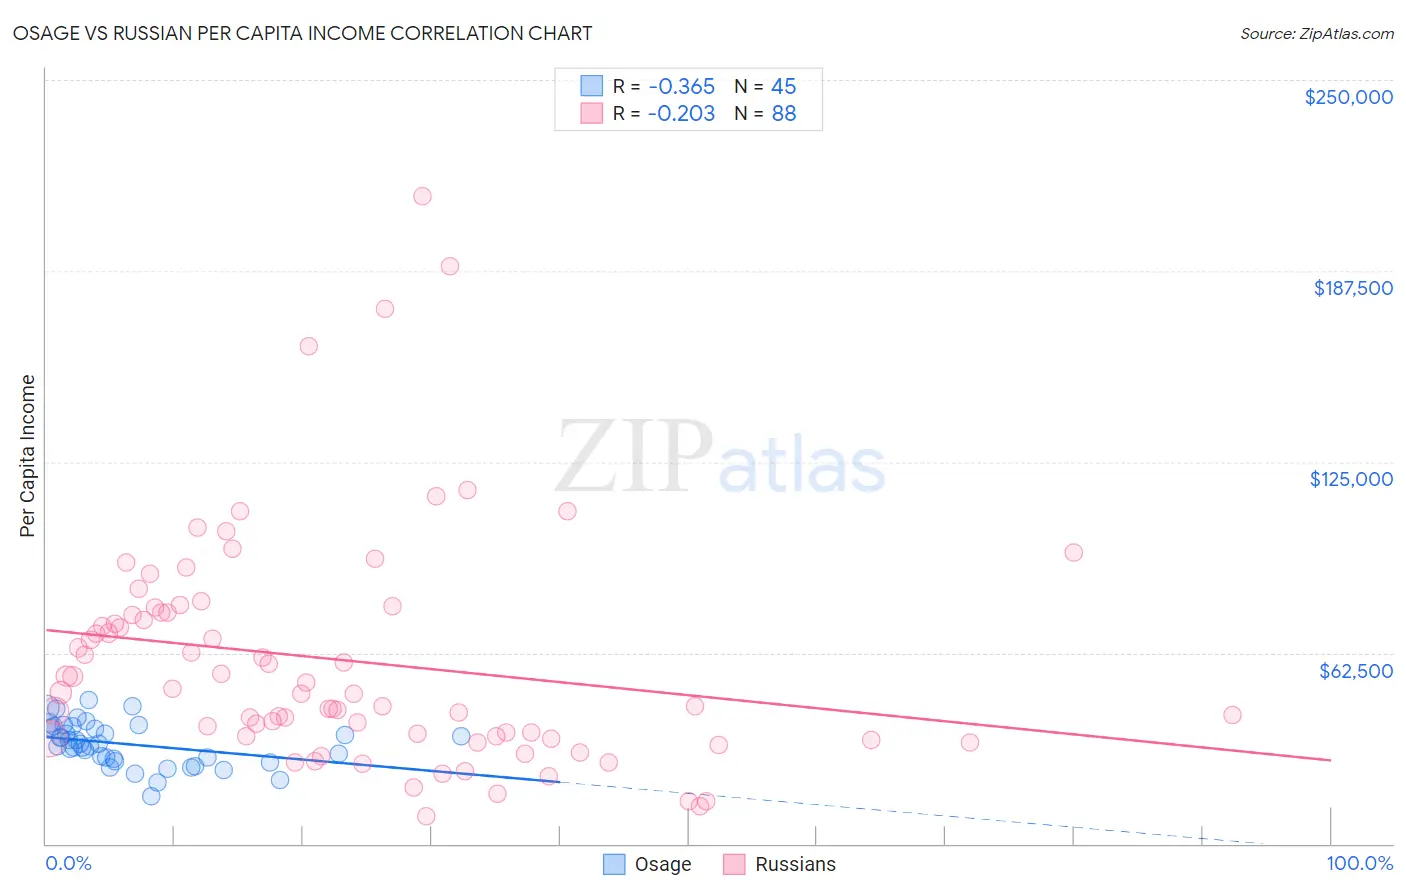
Osage vs Russian Per Capita Income Correlation Chart
The statistical analysis conducted on geographies consisting of 91,808,929 people shows a mild negative correlation between the proportion of Osage and per capita income in the United States with a correlation coefficient (R) of -0.365 and weighted average of $39,568. Similarly, the statistical analysis conducted on geographies consisting of 512,304,099 people shows a weak negative correlation between the proportion of Russians and per capita income in the United States with a correlation coefficient (R) of -0.203 and weighted average of $53,154, a difference of 34.3%.
Per Capita Income Correlation Summary
| Measurement | Osage | Russian |
| Minimum | $15,396 | $9,193 |
| Maximum | $46,906 | $212,036 |
| Range | $31,510 | $202,843 |
| Mean | $32,578 | $59,937 |
| Median | $32,608 | $49,383 |
| Interquartile 25% (IQ1) | $27,395 | $34,688 |
| Interquartile 75% (IQ3) | $38,257 | $75,613 |
| Interquartile Range (IQR) | $10,862 | $40,926 |
| Standard Deviation (Sample) | $7,093 | $37,845 |
| Standard Deviation (Population) | $7,014 | $37,630 |
Similar Demographics by Per Capita Income
Demographics Similar to Osage by Per Capita Income
In terms of per capita income, the demographic groups most similar to Osage are Alaska Native ($39,558, a difference of 0.020%), Immigrants from the Azores ($39,608, a difference of 0.10%), Immigrants from Middle Africa ($39,529, a difference of 0.10%), Hawaiian ($39,403, a difference of 0.42%), and Nicaraguan ($39,372, a difference of 0.50%).
| Demographics | Rating | Rank | Per Capita Income |
| Cree | 1.7 /100 | #246 | Tragic $40,056 |
| Immigrants | Somalia | 1.6 /100 | #247 | Tragic $39,974 |
| Cape Verdeans | 1.5 /100 | #248 | Tragic $39,935 |
| Japanese | 1.4 /100 | #249 | Tragic $39,870 |
| Immigrants | Burma/Myanmar | 1.3 /100 | #250 | Tragic $39,827 |
| Samoans | 1.3 /100 | #251 | Tragic $39,826 |
| Immigrants | Azores | 1.0 /100 | #252 | Tragic $39,608 |
| Osage | 1.0 /100 | #253 | Tragic $39,568 |
| Alaska Natives | 1.0 /100 | #254 | Tragic $39,558 |
| Immigrants | Middle Africa | 1.0 /100 | #255 | Tragic $39,529 |
| Hawaiians | 0.8 /100 | #256 | Tragic $39,403 |
| Nicaraguans | 0.8 /100 | #257 | Tragic $39,372 |
| Jamaicans | 0.7 /100 | #258 | Tragic $39,231 |
| Malaysians | 0.7 /100 | #259 | Tragic $39,194 |
| Alaskan Athabascans | 0.6 /100 | #260 | Tragic $39,163 |
Demographics Similar to Russians by Per Capita Income
In terms of per capita income, the demographic groups most similar to Russians are Immigrants from Japan ($53,359, a difference of 0.39%), Immigrants from South Central Asia ($52,660, a difference of 0.94%), Latvian ($52,649, a difference of 0.96%), Israeli ($52,596, a difference of 1.1%), and Immigrants from Denmark ($53,799, a difference of 1.2%).
| Demographics | Rating | Rank | Per Capita Income |
| Immigrants | China | 100.0 /100 | #19 | Exceptional $54,264 |
| Soviet Union | 100.0 /100 | #20 | Exceptional $54,202 |
| Immigrants | Northern Europe | 100.0 /100 | #21 | Exceptional $54,159 |
| Indians (Asian) | 100.0 /100 | #22 | Exceptional $53,874 |
| Immigrants | Eastern Asia | 100.0 /100 | #23 | Exceptional $53,806 |
| Immigrants | Denmark | 100.0 /100 | #24 | Exceptional $53,799 |
| Immigrants | Japan | 100.0 /100 | #25 | Exceptional $53,359 |
| Russians | 100.0 /100 | #26 | Exceptional $53,154 |
| Immigrants | South Central Asia | 100.0 /100 | #27 | Exceptional $52,660 |
| Latvians | 100.0 /100 | #28 | Exceptional $52,649 |
| Israelis | 100.0 /100 | #29 | Exceptional $52,596 |
| Immigrants | Austria | 100.0 /100 | #30 | Exceptional $52,503 |
| Turks | 100.0 /100 | #31 | Exceptional $52,391 |
| Immigrants | Norway | 100.0 /100 | #32 | Exceptional $52,217 |
| Australians | 100.0 /100 | #33 | Exceptional $52,074 |