Osage vs Immigrants from Moldova Per Capita Income
COMPARE
Osage
Immigrants from Moldova
Per Capita Income
Per Capita Income Comparison
Osage
Immigrants from Moldova
$39,568
PER CAPITA INCOME
1.0/ 100
METRIC RATING
253rd/ 347
METRIC RANK
$47,489
PER CAPITA INCOME
98.7/ 100
METRIC RATING
92nd/ 347
METRIC RANK
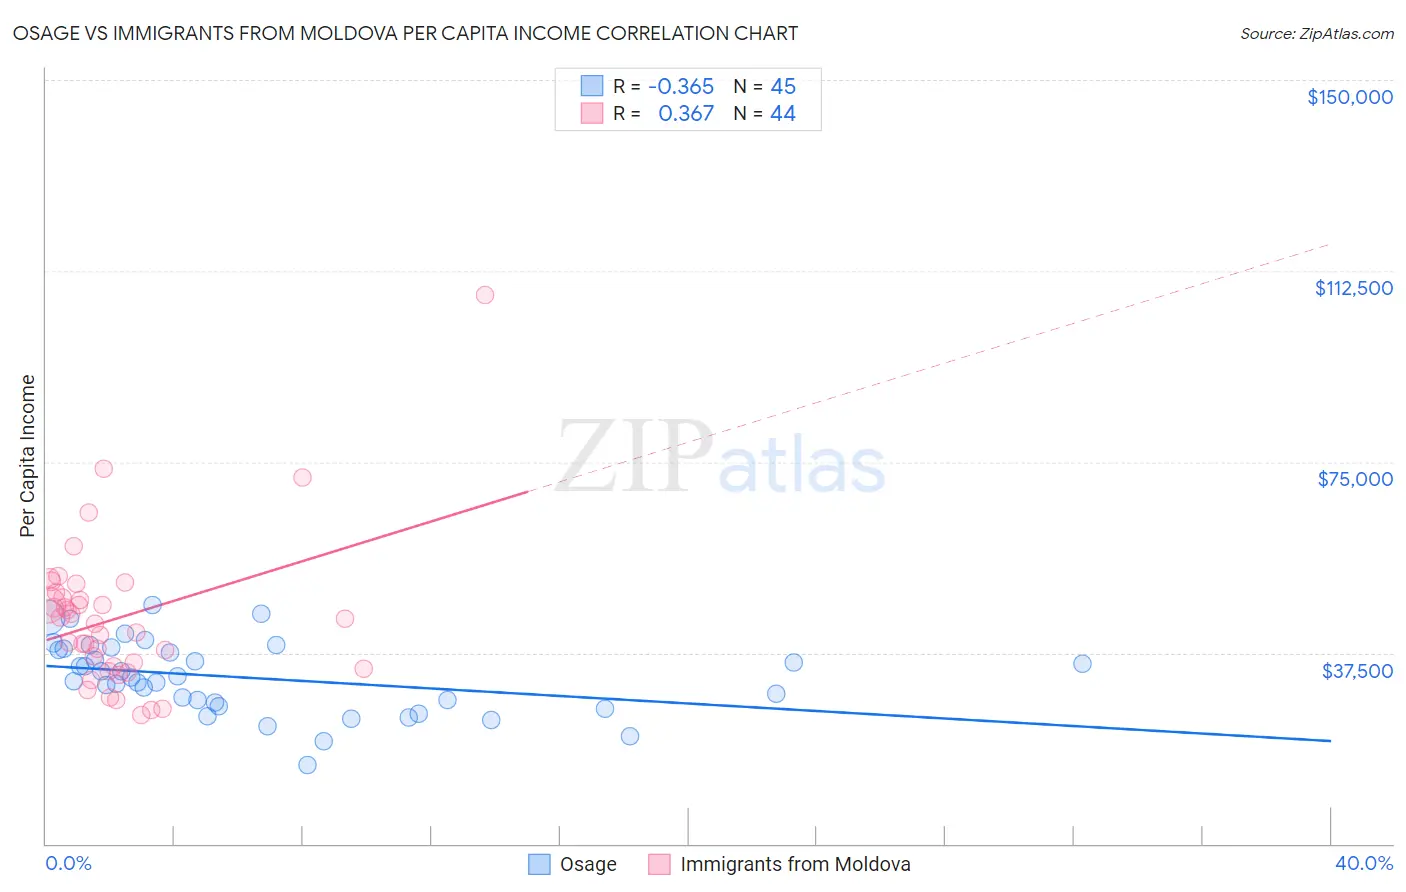
Osage vs Immigrants from Moldova Per Capita Income Correlation Chart
The statistical analysis conducted on geographies consisting of 91,808,929 people shows a mild negative correlation between the proportion of Osage and per capita income in the United States with a correlation coefficient (R) of -0.365 and weighted average of $39,568. Similarly, the statistical analysis conducted on geographies consisting of 124,402,409 people shows a mild positive correlation between the proportion of Immigrants from Moldova and per capita income in the United States with a correlation coefficient (R) of 0.367 and weighted average of $47,489, a difference of 20.0%.
Per Capita Income Correlation Summary
| Measurement | Osage | Immigrants from Moldova |
| Minimum | $15,396 | $25,195 |
| Maximum | $46,906 | $107,889 |
| Range | $31,510 | $82,694 |
| Mean | $32,578 | $44,404 |
| Median | $32,608 | $43,721 |
| Interquartile 25% (IQ1) | $27,395 | $34,656 |
| Interquartile 75% (IQ3) | $38,257 | $48,923 |
| Interquartile Range (IQR) | $10,862 | $14,267 |
| Standard Deviation (Sample) | $7,093 | $14,744 |
| Standard Deviation (Population) | $7,014 | $14,575 |
Similar Demographics by Per Capita Income
Demographics Similar to Osage by Per Capita Income
In terms of per capita income, the demographic groups most similar to Osage are Alaska Native ($39,558, a difference of 0.020%), Immigrants from the Azores ($39,608, a difference of 0.10%), Immigrants from Middle Africa ($39,529, a difference of 0.10%), Hawaiian ($39,403, a difference of 0.42%), and Nicaraguan ($39,372, a difference of 0.50%).
| Demographics | Rating | Rank | Per Capita Income |
| Cree | 1.7 /100 | #246 | Tragic $40,056 |
| Immigrants | Somalia | 1.6 /100 | #247 | Tragic $39,974 |
| Cape Verdeans | 1.5 /100 | #248 | Tragic $39,935 |
| Japanese | 1.4 /100 | #249 | Tragic $39,870 |
| Immigrants | Burma/Myanmar | 1.3 /100 | #250 | Tragic $39,827 |
| Samoans | 1.3 /100 | #251 | Tragic $39,826 |
| Immigrants | Azores | 1.0 /100 | #252 | Tragic $39,608 |
| Osage | 1.0 /100 | #253 | Tragic $39,568 |
| Alaska Natives | 1.0 /100 | #254 | Tragic $39,558 |
| Immigrants | Middle Africa | 1.0 /100 | #255 | Tragic $39,529 |
| Hawaiians | 0.8 /100 | #256 | Tragic $39,403 |
| Nicaraguans | 0.8 /100 | #257 | Tragic $39,372 |
| Jamaicans | 0.7 /100 | #258 | Tragic $39,231 |
| Malaysians | 0.7 /100 | #259 | Tragic $39,194 |
| Alaskan Athabascans | 0.6 /100 | #260 | Tragic $39,163 |
Demographics Similar to Immigrants from Moldova by Per Capita Income
In terms of per capita income, the demographic groups most similar to Immigrants from Moldova are Italian ($47,574, a difference of 0.18%), Macedonian ($47,573, a difference of 0.18%), Immigrants from Zimbabwe ($47,394, a difference of 0.20%), Albanian ($47,379, a difference of 0.23%), and Immigrants from Egypt ($47,361, a difference of 0.27%).
| Demographics | Rating | Rank | Per Capita Income |
| Austrians | 99.3 /100 | #85 | Exceptional $48,116 |
| Immigrants | Southern Europe | 99.3 /100 | #86 | Exceptional $48,027 |
| Ukrainians | 99.3 /100 | #87 | Exceptional $48,014 |
| Croatians | 99.0 /100 | #88 | Exceptional $47,742 |
| Northern Europeans | 98.9 /100 | #89 | Exceptional $47,698 |
| Italians | 98.8 /100 | #90 | Exceptional $47,574 |
| Macedonians | 98.8 /100 | #91 | Exceptional $47,573 |
| Immigrants | Moldova | 98.7 /100 | #92 | Exceptional $47,489 |
| Immigrants | Zimbabwe | 98.5 /100 | #93 | Exceptional $47,394 |
| Albanians | 98.5 /100 | #94 | Exceptional $47,379 |
| Immigrants | Egypt | 98.5 /100 | #95 | Exceptional $47,361 |
| Alsatians | 98.3 /100 | #96 | Exceptional $47,284 |
| Carpatho Rusyns | 98.2 /100 | #97 | Exceptional $47,248 |
| Immigrants | Pakistan | 97.9 /100 | #98 | Exceptional $47,084 |
| Laotians | 97.8 /100 | #99 | Exceptional $47,041 |