Osage vs Immigrants from Ecuador Per Capita Income
COMPARE
Osage
Immigrants from Ecuador
Per Capita Income
Per Capita Income Comparison
Osage
Immigrants from Ecuador
$39,568
PER CAPITA INCOME
1.0/ 100
METRIC RATING
253rd/ 347
METRIC RANK
$41,195
PER CAPITA INCOME
5.9/ 100
METRIC RATING
226th/ 347
METRIC RANK
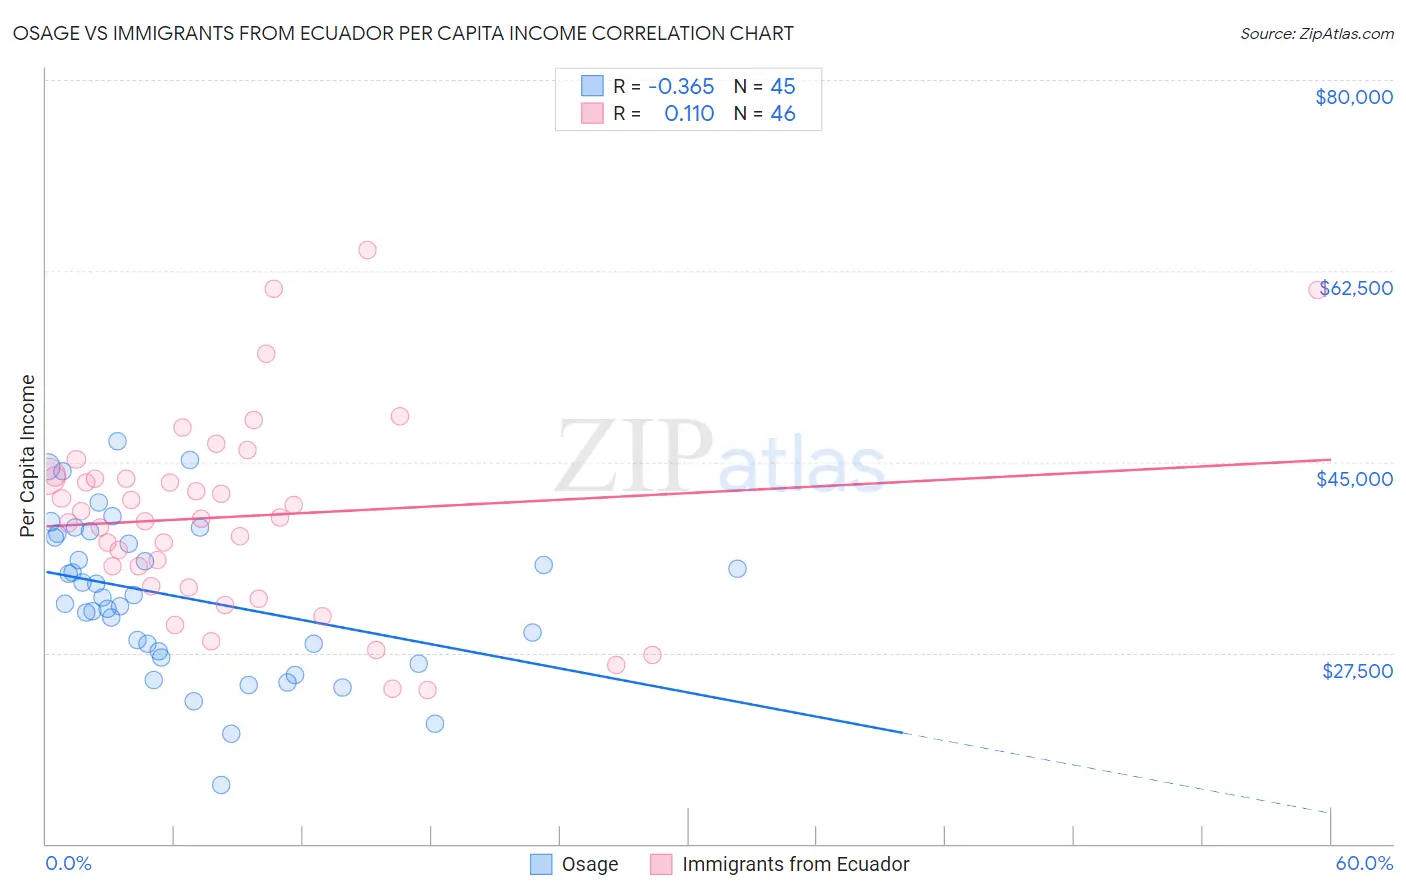
Osage vs Immigrants from Ecuador Per Capita Income Correlation Chart
The statistical analysis conducted on geographies consisting of 91,808,929 people shows a mild negative correlation between the proportion of Osage and per capita income in the United States with a correlation coefficient (R) of -0.365 and weighted average of $39,568. Similarly, the statistical analysis conducted on geographies consisting of 271,002,602 people shows a poor positive correlation between the proportion of Immigrants from Ecuador and per capita income in the United States with a correlation coefficient (R) of 0.110 and weighted average of $41,195, a difference of 4.1%.
Per Capita Income Correlation Summary
| Measurement | Osage | Immigrants from Ecuador |
| Minimum | $15,396 | $24,078 |
| Maximum | $46,906 | $64,385 |
| Range | $31,510 | $40,307 |
| Mean | $32,578 | $40,002 |
| Median | $32,608 | $39,852 |
| Interquartile 25% (IQ1) | $27,395 | $33,648 |
| Interquartile 75% (IQ3) | $38,257 | $43,627 |
| Interquartile Range (IQR) | $10,862 | $9,979 |
| Standard Deviation (Sample) | $7,093 | $9,075 |
| Standard Deviation (Population) | $7,014 | $8,976 |
Similar Demographics by Per Capita Income
Demographics Similar to Osage by Per Capita Income
In terms of per capita income, the demographic groups most similar to Osage are Alaska Native ($39,558, a difference of 0.020%), Immigrants from the Azores ($39,608, a difference of 0.10%), Immigrants from Middle Africa ($39,529, a difference of 0.10%), Hawaiian ($39,403, a difference of 0.42%), and Nicaraguan ($39,372, a difference of 0.50%).
| Demographics | Rating | Rank | Per Capita Income |
| Cree | 1.7 /100 | #246 | Tragic $40,056 |
| Immigrants | Somalia | 1.6 /100 | #247 | Tragic $39,974 |
| Cape Verdeans | 1.5 /100 | #248 | Tragic $39,935 |
| Japanese | 1.4 /100 | #249 | Tragic $39,870 |
| Immigrants | Burma/Myanmar | 1.3 /100 | #250 | Tragic $39,827 |
| Samoans | 1.3 /100 | #251 | Tragic $39,826 |
| Immigrants | Azores | 1.0 /100 | #252 | Tragic $39,608 |
| Osage | 1.0 /100 | #253 | Tragic $39,568 |
| Alaska Natives | 1.0 /100 | #254 | Tragic $39,558 |
| Immigrants | Middle Africa | 1.0 /100 | #255 | Tragic $39,529 |
| Hawaiians | 0.8 /100 | #256 | Tragic $39,403 |
| Nicaraguans | 0.8 /100 | #257 | Tragic $39,372 |
| Jamaicans | 0.7 /100 | #258 | Tragic $39,231 |
| Malaysians | 0.7 /100 | #259 | Tragic $39,194 |
| Alaskan Athabascans | 0.6 /100 | #260 | Tragic $39,163 |
Demographics Similar to Immigrants from Ecuador by Per Capita Income
In terms of per capita income, the demographic groups most similar to Immigrants from Ecuador are West Indian ($41,217, a difference of 0.050%), Immigrants from Ghana ($41,131, a difference of 0.16%), Immigrants from Grenada ($41,123, a difference of 0.17%), Immigrants from St. Vincent and the Grenadines ($41,270, a difference of 0.18%), and Immigrants from Cameroon ($41,334, a difference of 0.34%).
| Demographics | Rating | Rank | Per Capita Income |
| Puget Sound Salish | 8.1 /100 | #219 | Tragic $41,495 |
| Immigrants | Barbados | 7.9 /100 | #220 | Tragic $41,478 |
| Immigrants | Trinidad and Tobago | 7.9 /100 | #221 | Tragic $41,476 |
| Immigrants | Iraq | 7.1 /100 | #222 | Tragic $41,365 |
| Immigrants | Cameroon | 6.8 /100 | #223 | Tragic $41,334 |
| Immigrants | St. Vincent and the Grenadines | 6.4 /100 | #224 | Tragic $41,270 |
| West Indians | 6.0 /100 | #225 | Tragic $41,217 |
| Immigrants | Ecuador | 5.9 /100 | #226 | Tragic $41,195 |
| Immigrants | Ghana | 5.5 /100 | #227 | Tragic $41,131 |
| Immigrants | Grenada | 5.5 /100 | #228 | Tragic $41,123 |
| Nigerians | 4.9 /100 | #229 | Tragic $41,026 |
| Native Hawaiians | 4.9 /100 | #230 | Tragic $41,017 |
| Senegalese | 4.8 /100 | #231 | Tragic $41,000 |
| Guyanese | 4.5 /100 | #232 | Tragic $40,949 |
| Delaware | 3.8 /100 | #233 | Tragic $40,778 |