Osage vs Immigrants from Uzbekistan Per Capita Income
COMPARE
Osage
Immigrants from Uzbekistan
Per Capita Income
Per Capita Income Comparison
Osage
Immigrants from Uzbekistan
$39,568
PER CAPITA INCOME
1.0/ 100
METRIC RATING
253rd/ 347
METRIC RANK
$46,929
PER CAPITA INCOME
97.5/ 100
METRIC RATING
101st/ 347
METRIC RANK
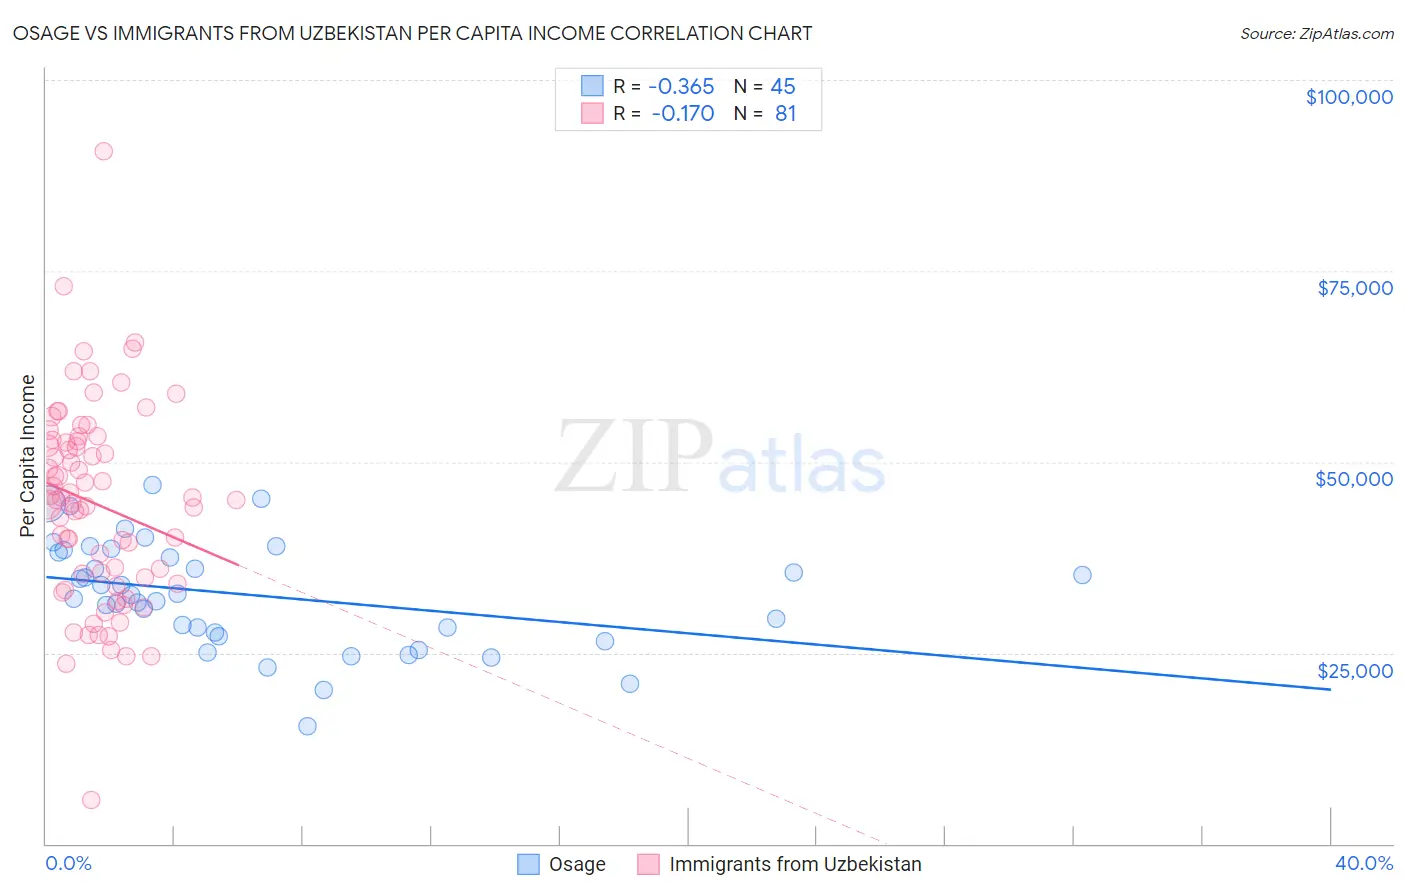
Osage vs Immigrants from Uzbekistan Per Capita Income Correlation Chart
The statistical analysis conducted on geographies consisting of 91,808,929 people shows a mild negative correlation between the proportion of Osage and per capita income in the United States with a correlation coefficient (R) of -0.365 and weighted average of $39,568. Similarly, the statistical analysis conducted on geographies consisting of 118,766,454 people shows a poor negative correlation between the proportion of Immigrants from Uzbekistan and per capita income in the United States with a correlation coefficient (R) of -0.170 and weighted average of $46,929, a difference of 18.6%.
Per Capita Income Correlation Summary
| Measurement | Osage | Immigrants from Uzbekistan |
| Minimum | $15,396 | $5,747 |
| Maximum | $46,906 | $90,679 |
| Range | $31,510 | $84,932 |
| Mean | $32,578 | $44,513 |
| Median | $32,608 | $45,080 |
| Interquartile 25% (IQ1) | $27,395 | $34,402 |
| Interquartile 75% (IQ3) | $38,257 | $52,838 |
| Interquartile Range (IQR) | $10,862 | $18,436 |
| Standard Deviation (Sample) | $7,093 | $13,145 |
| Standard Deviation (Population) | $7,014 | $13,064 |
Similar Demographics by Per Capita Income
Demographics Similar to Osage by Per Capita Income
In terms of per capita income, the demographic groups most similar to Osage are Alaska Native ($39,558, a difference of 0.020%), Immigrants from the Azores ($39,608, a difference of 0.10%), Immigrants from Middle Africa ($39,529, a difference of 0.10%), Hawaiian ($39,403, a difference of 0.42%), and Nicaraguan ($39,372, a difference of 0.50%).
| Demographics | Rating | Rank | Per Capita Income |
| Cree | 1.7 /100 | #246 | Tragic $40,056 |
| Immigrants | Somalia | 1.6 /100 | #247 | Tragic $39,974 |
| Cape Verdeans | 1.5 /100 | #248 | Tragic $39,935 |
| Japanese | 1.4 /100 | #249 | Tragic $39,870 |
| Immigrants | Burma/Myanmar | 1.3 /100 | #250 | Tragic $39,827 |
| Samoans | 1.3 /100 | #251 | Tragic $39,826 |
| Immigrants | Azores | 1.0 /100 | #252 | Tragic $39,608 |
| Osage | 1.0 /100 | #253 | Tragic $39,568 |
| Alaska Natives | 1.0 /100 | #254 | Tragic $39,558 |
| Immigrants | Middle Africa | 1.0 /100 | #255 | Tragic $39,529 |
| Hawaiians | 0.8 /100 | #256 | Tragic $39,403 |
| Nicaraguans | 0.8 /100 | #257 | Tragic $39,372 |
| Jamaicans | 0.7 /100 | #258 | Tragic $39,231 |
| Malaysians | 0.7 /100 | #259 | Tragic $39,194 |
| Alaskan Athabascans | 0.6 /100 | #260 | Tragic $39,163 |
Demographics Similar to Immigrants from Uzbekistan by Per Capita Income
In terms of per capita income, the demographic groups most similar to Immigrants from Uzbekistan are Immigrants from Lebanon ($46,938, a difference of 0.020%), Immigrants from Western Asia ($46,876, a difference of 0.11%), Syrian ($46,837, a difference of 0.20%), Laotian ($47,041, a difference of 0.24%), and Immigrants from Pakistan ($47,084, a difference of 0.33%).
| Demographics | Rating | Rank | Per Capita Income |
| Albanians | 98.5 /100 | #94 | Exceptional $47,379 |
| Immigrants | Egypt | 98.5 /100 | #95 | Exceptional $47,361 |
| Alsatians | 98.3 /100 | #96 | Exceptional $47,284 |
| Carpatho Rusyns | 98.2 /100 | #97 | Exceptional $47,248 |
| Immigrants | Pakistan | 97.9 /100 | #98 | Exceptional $47,084 |
| Laotians | 97.8 /100 | #99 | Exceptional $47,041 |
| Immigrants | Lebanon | 97.5 /100 | #100 | Exceptional $46,938 |
| Immigrants | Uzbekistan | 97.5 /100 | #101 | Exceptional $46,929 |
| Immigrants | Western Asia | 97.4 /100 | #102 | Exceptional $46,876 |
| Syrians | 97.2 /100 | #103 | Exceptional $46,837 |
| Brazilians | 96.8 /100 | #104 | Exceptional $46,700 |
| British | 96.3 /100 | #105 | Exceptional $46,571 |
| Ethiopians | 96.3 /100 | #106 | Exceptional $46,569 |
| Serbians | 96.2 /100 | #107 | Exceptional $46,551 |
| Immigrants | Kuwait | 96.2 /100 | #108 | Exceptional $46,543 |