Osage vs Immigrants from Eritrea Unemployment Among Women with Children Under 6 years
COMPARE
Osage
Immigrants from Eritrea
Unemployment Among Women with Children Under 6 years
Unemployment Among Women with Children Under 6 years Comparison
Osage
Immigrants from Eritrea
9.5%
UNEMPLOYMENT AMONG WOMEN WITH CHILDREN UNDER 6 YEARS
0.0/ 100
METRIC RATING
318th/ 347
METRIC RANK
7.0%
UNEMPLOYMENT AMONG WOMEN WITH CHILDREN UNDER 6 YEARS
99.4/ 100
METRIC RATING
69th/ 347
METRIC RANK
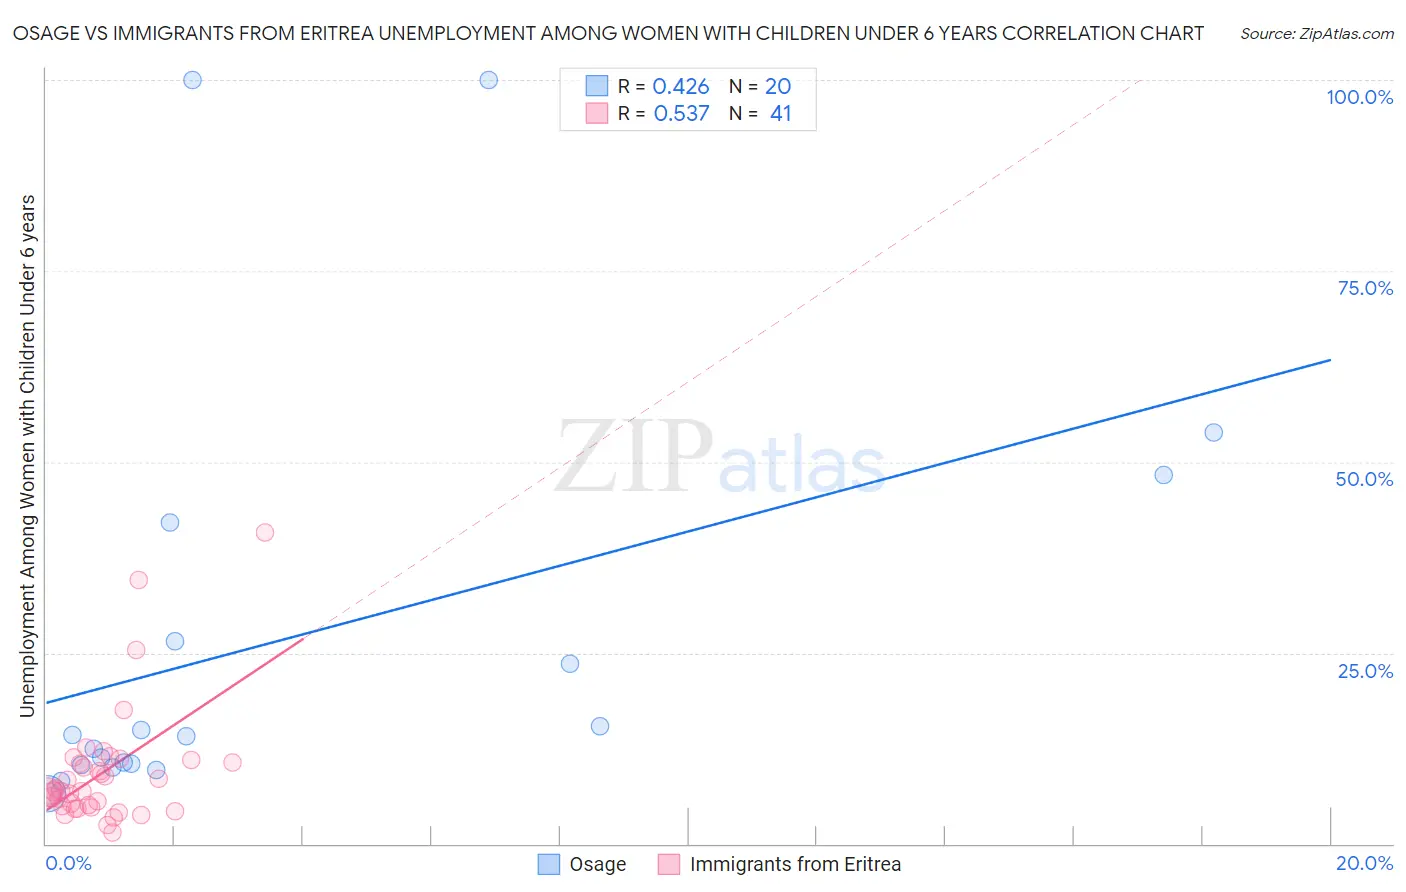
Osage vs Immigrants from Eritrea Unemployment Among Women with Children Under 6 years Correlation Chart
The statistical analysis conducted on geographies consisting of 83,364,360 people shows a moderate positive correlation between the proportion of Osage and unemployment rate among women with children under the age of 6 in the United States with a correlation coefficient (R) of 0.426 and weighted average of 9.5%. Similarly, the statistical analysis conducted on geographies consisting of 96,202,979 people shows a substantial positive correlation between the proportion of Immigrants from Eritrea and unemployment rate among women with children under the age of 6 in the United States with a correlation coefficient (R) of 0.537 and weighted average of 7.0%, a difference of 35.6%.
Unemployment Among Women with Children Under 6 years Correlation Summary
| Measurement | Osage | Immigrants from Eritrea |
| Minimum | 6.6% | 1.4% |
| Maximum | 100.0% | 40.8% |
| Range | 93.4% | 39.4% |
| Mean | 27.1% | 9.3% |
| Median | 14.2% | 6.9% |
| Interquartile 25% (IQ1) | 10.4% | 4.9% |
| Interquartile 75% (IQ3) | 34.3% | 10.9% |
| Interquartile Range (IQR) | 23.9% | 6.0% |
| Standard Deviation (Sample) | 28.4% | 7.8% |
| Standard Deviation (Population) | 27.7% | 7.7% |
Similar Demographics by Unemployment Among Women with Children Under 6 years
Demographics Similar to Osage by Unemployment Among Women with Children Under 6 years
In terms of unemployment among women with children under 6 years, the demographic groups most similar to Osage are Dutch West Indian (9.5%, a difference of 0.060%), Houma (9.4%, a difference of 0.85%), Marshallese (9.6%, a difference of 1.0%), Potawatomi (9.6%, a difference of 1.1%), and Central American Indian (9.6%, a difference of 1.1%).
| Demographics | Rating | Rank | Unemployment Among Women with Children Under 6 years |
| French American Indians | 0.0 /100 | #311 | Tragic 9.2% |
| Immigrants | Azores | 0.0 /100 | #312 | Tragic 9.2% |
| Americans | 0.0 /100 | #313 | Tragic 9.3% |
| Fijians | 0.0 /100 | #314 | Tragic 9.3% |
| Cherokee | 0.0 /100 | #315 | Tragic 9.3% |
| Houma | 0.0 /100 | #316 | Tragic 9.4% |
| Dutch West Indians | 0.0 /100 | #317 | Tragic 9.5% |
| Osage | 0.0 /100 | #318 | Tragic 9.5% |
| Marshallese | 0.0 /100 | #319 | Tragic 9.6% |
| Potawatomi | 0.0 /100 | #320 | Tragic 9.6% |
| Central American Indians | 0.0 /100 | #321 | Tragic 9.6% |
| Alaska Natives | 0.0 /100 | #322 | Tragic 9.6% |
| Immigrants | Bahamas | 0.0 /100 | #323 | Tragic 9.6% |
| Paiute | 0.0 /100 | #324 | Tragic 9.7% |
| Choctaw | 0.0 /100 | #325 | Tragic 9.8% |
Demographics Similar to Immigrants from Eritrea by Unemployment Among Women with Children Under 6 years
In terms of unemployment among women with children under 6 years, the demographic groups most similar to Immigrants from Eritrea are Immigrants from Iraq (7.0%, a difference of 0.010%), Paraguayan (7.0%, a difference of 0.030%), Afghan (7.0%, a difference of 0.040%), Cuban (7.0%, a difference of 0.14%), and Immigrants from Netherlands (7.0%, a difference of 0.26%).
| Demographics | Rating | Rank | Unemployment Among Women with Children Under 6 years |
| Somalis | 99.7 /100 | #62 | Exceptional 6.9% |
| Maltese | 99.7 /100 | #63 | Exceptional 6.9% |
| Tongans | 99.7 /100 | #64 | Exceptional 6.9% |
| Immigrants | Kuwait | 99.7 /100 | #65 | Exceptional 6.9% |
| Immigrants | Belgium | 99.6 /100 | #66 | Exceptional 6.9% |
| Immigrants | Netherlands | 99.5 /100 | #67 | Exceptional 7.0% |
| Paraguayans | 99.4 /100 | #68 | Exceptional 7.0% |
| Immigrants | Eritrea | 99.4 /100 | #69 | Exceptional 7.0% |
| Immigrants | Iraq | 99.4 /100 | #70 | Exceptional 7.0% |
| Afghans | 99.4 /100 | #71 | Exceptional 7.0% |
| Cubans | 99.4 /100 | #72 | Exceptional 7.0% |
| Immigrants | Czechoslovakia | 99.2 /100 | #73 | Exceptional 7.0% |
| Turks | 99.2 /100 | #74 | Exceptional 7.0% |
| Immigrants | Eastern Europe | 99.0 /100 | #75 | Exceptional 7.1% |
| Estonians | 99.0 /100 | #76 | Exceptional 7.1% |