Osage vs Immigrants from Netherlands Per Capita Income
COMPARE
Osage
Immigrants from Netherlands
Per Capita Income
Per Capita Income Comparison
Osage
Immigrants from Netherlands
$39,568
PER CAPITA INCOME
1.0/ 100
METRIC RATING
253rd/ 347
METRIC RANK
$50,458
PER CAPITA INCOME
100.0/ 100
METRIC RATING
51st/ 347
METRIC RANK
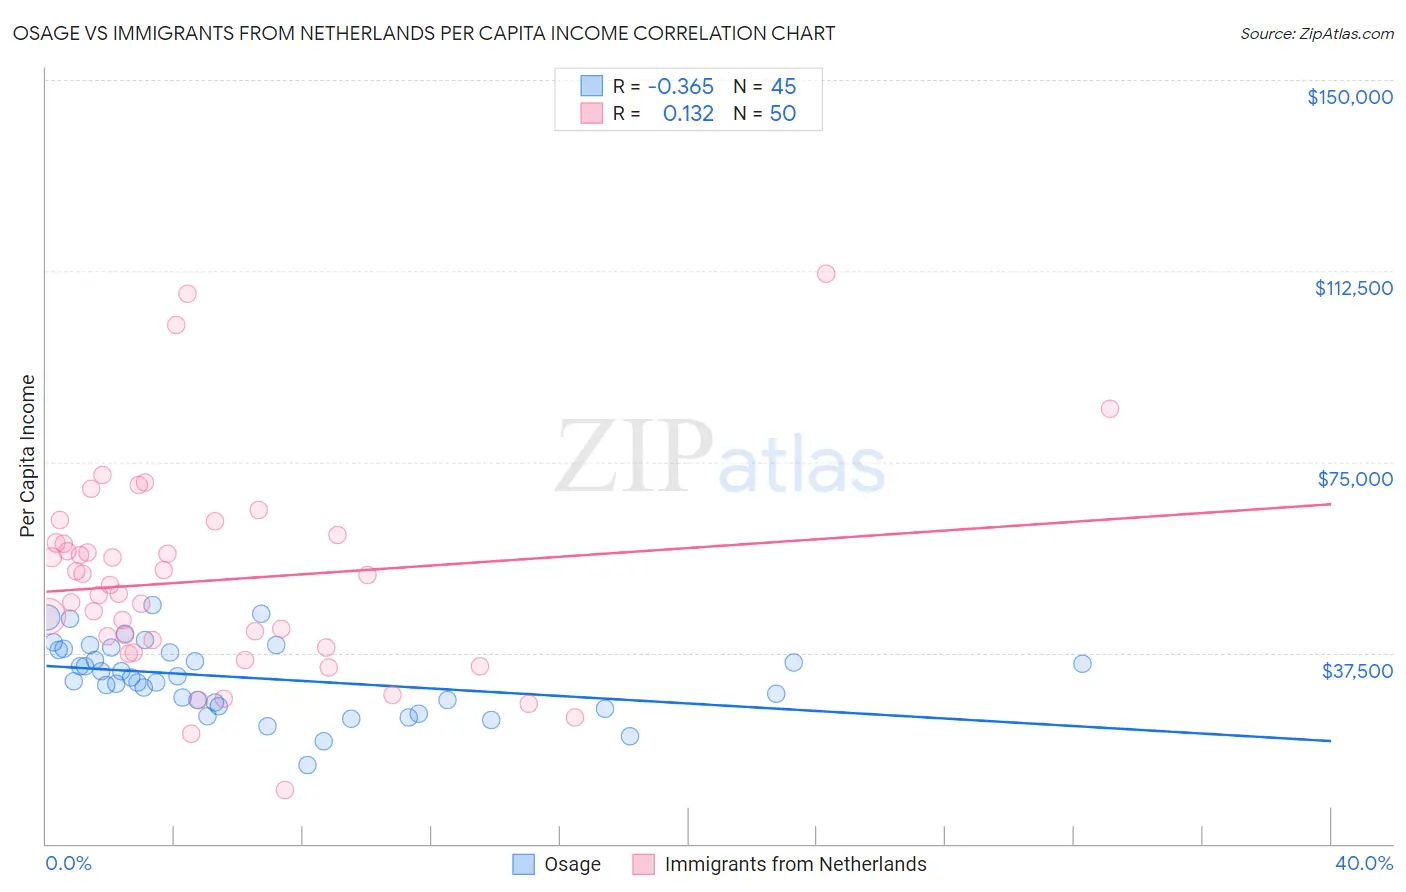
Osage vs Immigrants from Netherlands Per Capita Income Correlation Chart
The statistical analysis conducted on geographies consisting of 91,808,929 people shows a mild negative correlation between the proportion of Osage and per capita income in the United States with a correlation coefficient (R) of -0.365 and weighted average of $39,568. Similarly, the statistical analysis conducted on geographies consisting of 237,881,407 people shows a poor positive correlation between the proportion of Immigrants from Netherlands and per capita income in the United States with a correlation coefficient (R) of 0.132 and weighted average of $50,458, a difference of 27.5%.
Per Capita Income Correlation Summary
| Measurement | Osage | Immigrants from Netherlands |
| Minimum | $15,396 | $10,464 |
| Maximum | $46,906 | $111,976 |
| Range | $31,510 | $101,512 |
| Mean | $32,578 | $51,773 |
| Median | $32,608 | $49,974 |
| Interquartile 25% (IQ1) | $27,395 | $38,654 |
| Interquartile 75% (IQ3) | $38,257 | $59,110 |
| Interquartile Range (IQR) | $10,862 | $20,456 |
| Standard Deviation (Sample) | $7,093 | $20,417 |
| Standard Deviation (Population) | $7,014 | $20,212 |
Similar Demographics by Per Capita Income
Demographics Similar to Osage by Per Capita Income
In terms of per capita income, the demographic groups most similar to Osage are Alaska Native ($39,558, a difference of 0.020%), Immigrants from the Azores ($39,608, a difference of 0.10%), Immigrants from Middle Africa ($39,529, a difference of 0.10%), Hawaiian ($39,403, a difference of 0.42%), and Nicaraguan ($39,372, a difference of 0.50%).
| Demographics | Rating | Rank | Per Capita Income |
| Cree | 1.7 /100 | #246 | Tragic $40,056 |
| Immigrants | Somalia | 1.6 /100 | #247 | Tragic $39,974 |
| Cape Verdeans | 1.5 /100 | #248 | Tragic $39,935 |
| Japanese | 1.4 /100 | #249 | Tragic $39,870 |
| Immigrants | Burma/Myanmar | 1.3 /100 | #250 | Tragic $39,827 |
| Samoans | 1.3 /100 | #251 | Tragic $39,826 |
| Immigrants | Azores | 1.0 /100 | #252 | Tragic $39,608 |
| Osage | 1.0 /100 | #253 | Tragic $39,568 |
| Alaska Natives | 1.0 /100 | #254 | Tragic $39,558 |
| Immigrants | Middle Africa | 1.0 /100 | #255 | Tragic $39,529 |
| Hawaiians | 0.8 /100 | #256 | Tragic $39,403 |
| Nicaraguans | 0.8 /100 | #257 | Tragic $39,372 |
| Jamaicans | 0.7 /100 | #258 | Tragic $39,231 |
| Malaysians | 0.7 /100 | #259 | Tragic $39,194 |
| Alaskan Athabascans | 0.6 /100 | #260 | Tragic $39,163 |
Demographics Similar to Immigrants from Netherlands by Per Capita Income
In terms of per capita income, the demographic groups most similar to Immigrants from Netherlands are Immigrants from Croatia ($50,417, a difference of 0.080%), Paraguayan ($50,385, a difference of 0.14%), Immigrants from Sri Lanka ($50,555, a difference of 0.19%), New Zealander ($50,575, a difference of 0.23%), and Immigrants from Belarus ($50,303, a difference of 0.31%).
| Demographics | Rating | Rank | Per Capita Income |
| Immigrants | Europe | 100.0 /100 | #44 | Exceptional $50,950 |
| Immigrants | Spain | 100.0 /100 | #45 | Exceptional $50,933 |
| Immigrants | Latvia | 100.0 /100 | #46 | Exceptional $50,914 |
| Bulgarians | 100.0 /100 | #47 | Exceptional $50,906 |
| Immigrants | Serbia | 100.0 /100 | #48 | Exceptional $50,810 |
| New Zealanders | 100.0 /100 | #49 | Exceptional $50,575 |
| Immigrants | Sri Lanka | 100.0 /100 | #50 | Exceptional $50,555 |
| Immigrants | Netherlands | 100.0 /100 | #51 | Exceptional $50,458 |
| Immigrants | Croatia | 99.9 /100 | #52 | Exceptional $50,417 |
| Paraguayans | 99.9 /100 | #53 | Exceptional $50,385 |
| Immigrants | Belarus | 99.9 /100 | #54 | Exceptional $50,303 |
| Immigrants | Western Europe | 99.9 /100 | #55 | Exceptional $50,065 |
| Asians | 99.9 /100 | #56 | Exceptional $50,057 |
| South Africans | 99.9 /100 | #57 | Exceptional $50,044 |
| Immigrants | Malaysia | 99.9 /100 | #58 | Exceptional $49,983 |