Nonimmigrants vs Immigrants from Vietnam Married-couple Households
COMPARE
Nonimmigrants
Immigrants from Vietnam
Married-couple Households
Married-couple Households Comparison
Nonimmigrants
Immigrants from Vietnam
46.9%
MARRIED-COUPLE HOUSEHOLDS
73.3/ 100
METRIC RATING
158th/ 347
METRIC RANK
48.8%
MARRIED-COUPLE HOUSEHOLDS
99.6/ 100
METRIC RATING
42nd/ 347
METRIC RANK
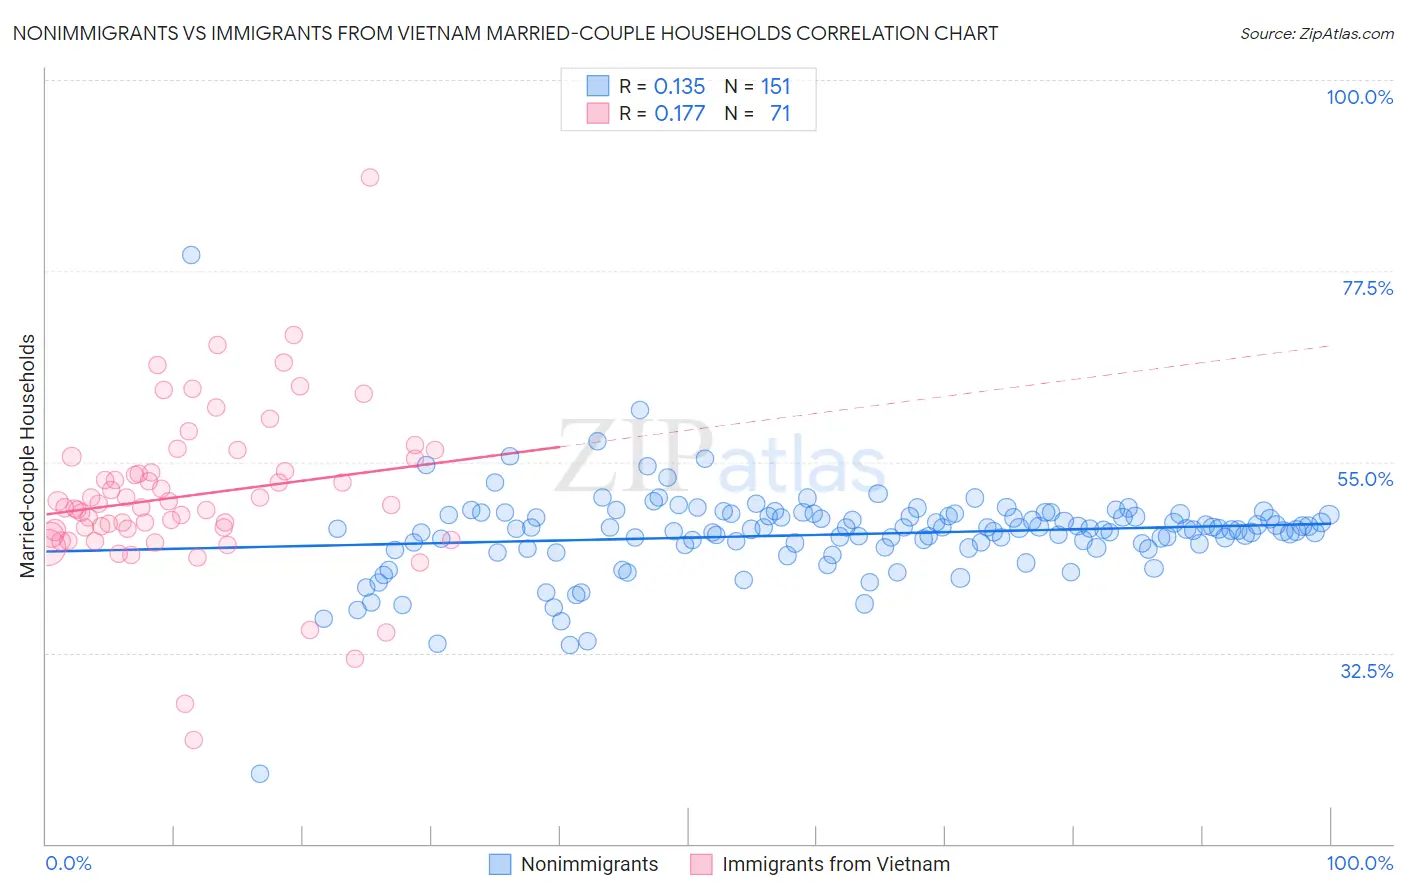
Nonimmigrants vs Immigrants from Vietnam Married-couple Households Correlation Chart
The statistical analysis conducted on geographies consisting of 584,564,582 people shows a poor positive correlation between the proportion of Nonimmigrants and percentage of married-couple family households in the United States with a correlation coefficient (R) of 0.135 and weighted average of 46.9%. Similarly, the statistical analysis conducted on geographies consisting of 404,551,130 people shows a poor positive correlation between the proportion of Immigrants from Vietnam and percentage of married-couple family households in the United States with a correlation coefficient (R) of 0.177 and weighted average of 48.8%, a difference of 4.2%.
Married-couple Households Correlation Summary
| Measurement | Nonimmigrants | Immigrants from Vietnam |
| Minimum | 18.2% | 22.2% |
| Maximum | 79.3% | 88.5% |
| Range | 61.2% | 66.2% |
| Mean | 46.5% | 51.1% |
| Median | 47.0% | 49.9% |
| Interquartile 25% (IQ1) | 45.0% | 47.0% |
| Interquartile 75% (IQ3) | 48.7% | 55.3% |
| Interquartile Range (IQR) | 3.7% | 8.3% |
| Standard Deviation (Sample) | 5.5% | 9.7% |
| Standard Deviation (Population) | 5.5% | 9.6% |
Similar Demographics by Married-couple Households
Demographics Similar to Nonimmigrants by Married-couple Households
In terms of married-couple households, the demographic groups most similar to Nonimmigrants are Osage (46.9%, a difference of 0.0%), Iraqi (46.9%, a difference of 0.070%), Immigrants from Oceania (46.9%, a difference of 0.080%), Armenian (46.9%, a difference of 0.10%), and Delaware (46.8%, a difference of 0.10%).
| Demographics | Rating | Rank | Married-couple Households |
| Immigrants | Bulgaria | 76.8 /100 | #151 | Good 47.0% |
| Serbians | 76.3 /100 | #152 | Good 47.0% |
| Hmong | 76.2 /100 | #153 | Good 47.0% |
| Immigrants | Western Asia | 76.1 /100 | #154 | Good 46.9% |
| Arabs | 76.0 /100 | #155 | Good 46.9% |
| Armenians | 75.4 /100 | #156 | Good 46.9% |
| Immigrants | Oceania | 74.8 /100 | #157 | Good 46.9% |
| Immigrants | Nonimmigrants | 73.3 /100 | #158 | Good 46.9% |
| Osage | 73.2 /100 | #159 | Good 46.9% |
| Iraqis | 71.7 /100 | #160 | Good 46.9% |
| Delaware | 71.2 /100 | #161 | Good 46.8% |
| Colombians | 71.0 /100 | #162 | Good 46.8% |
| Immigrants | Turkey | 70.2 /100 | #163 | Good 46.8% |
| Immigrants | Kazakhstan | 70.0 /100 | #164 | Good 46.8% |
| Immigrants | Southern Europe | 69.9 /100 | #165 | Good 46.8% |
Demographics Similar to Immigrants from Vietnam by Married-couple Households
In terms of married-couple households, the demographic groups most similar to Immigrants from Vietnam are Immigrants from Lebanon (48.9%, a difference of 0.050%), Immigrants from Iran (48.8%, a difference of 0.060%), Immigrants from Bolivia (48.9%, a difference of 0.080%), Lithuanian (48.9%, a difference of 0.090%), and Welsh (48.8%, a difference of 0.10%).
| Demographics | Rating | Rank | Married-couple Households |
| Scottish | 99.7 /100 | #35 | Exceptional 49.0% |
| Iranians | 99.7 /100 | #36 | Exceptional 49.0% |
| Sri Lankans | 99.7 /100 | #37 | Exceptional 49.0% |
| Greeks | 99.7 /100 | #38 | Exceptional 48.9% |
| Lithuanians | 99.6 /100 | #39 | Exceptional 48.9% |
| Immigrants | Bolivia | 99.6 /100 | #40 | Exceptional 48.9% |
| Immigrants | Lebanon | 99.6 /100 | #41 | Exceptional 48.9% |
| Immigrants | Vietnam | 99.6 /100 | #42 | Exceptional 48.8% |
| Immigrants | Iran | 99.6 /100 | #43 | Exceptional 48.8% |
| Welsh | 99.5 /100 | #44 | Exceptional 48.8% |
| Immigrants | Eastern Asia | 99.5 /100 | #45 | Exceptional 48.8% |
| Tsimshian | 99.5 /100 | #46 | Exceptional 48.7% |
| British | 99.5 /100 | #47 | Exceptional 48.7% |
| Indians (Asian) | 99.4 /100 | #48 | Exceptional 48.7% |
| Immigrants | Sri Lanka | 99.4 /100 | #49 | Exceptional 48.7% |