Native/Alaskan vs Luxembourger Householder Income Over 65 years
COMPARE
Native/Alaskan
Luxembourger
Householder Income Over 65 years
Householder Income Over 65 years Comparison
Natives/Alaskans
Luxembourgers
$52,081
HOUSEHOLDER INCOME OVER 65 YEARS
0.0/ 100
METRIC RATING
314th/ 347
METRIC RANK
$60,967
HOUSEHOLDER INCOME OVER 65 YEARS
50.0/ 100
METRIC RATING
174th/ 347
METRIC RANK
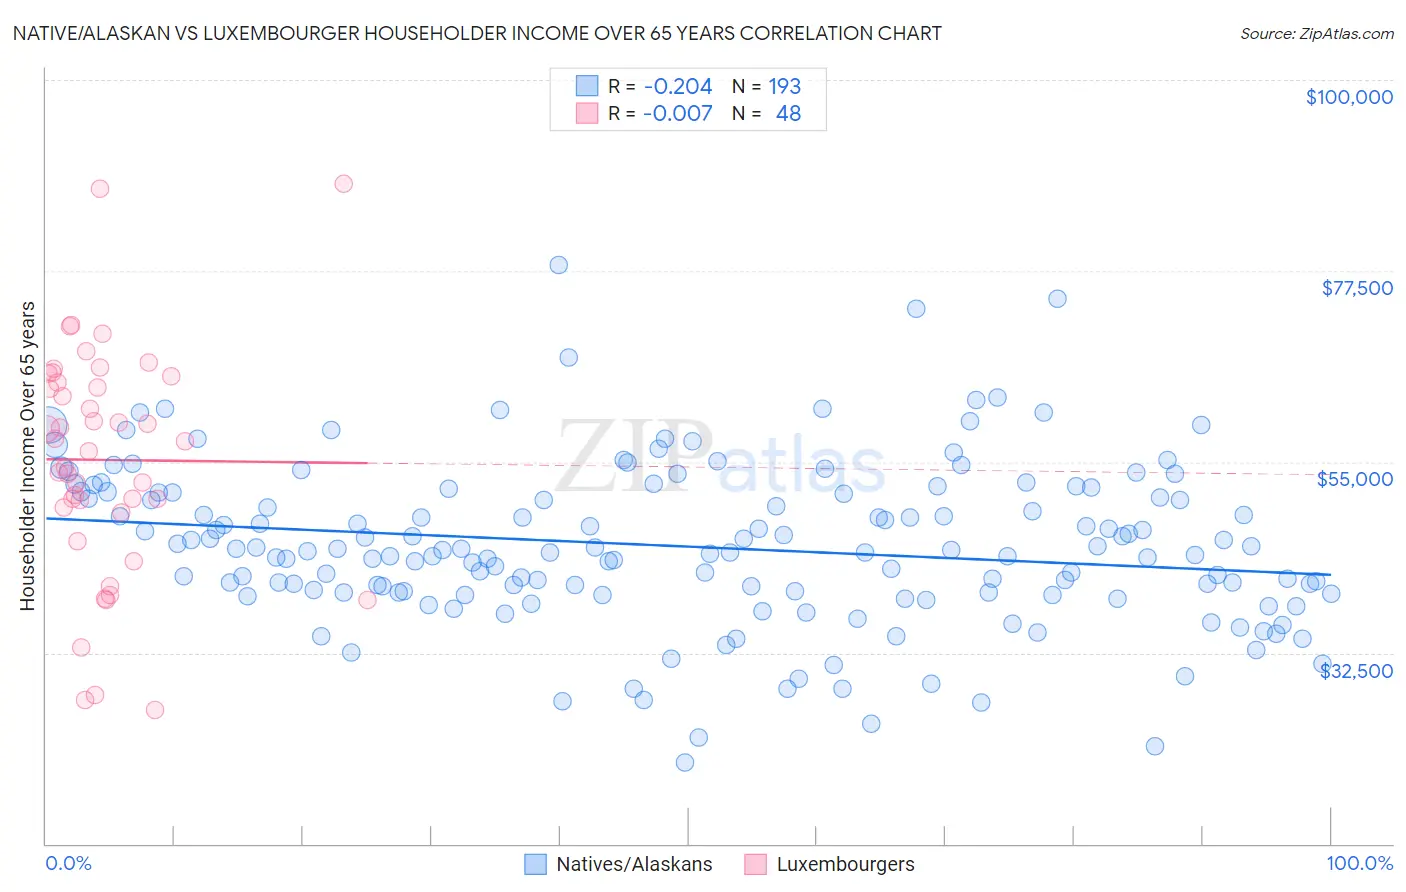
Native/Alaskan vs Luxembourger Householder Income Over 65 years Correlation Chart
The statistical analysis conducted on geographies consisting of 509,572,105 people shows a weak negative correlation between the proportion of Natives/Alaskans and household income with householder over the age of 65 in the United States with a correlation coefficient (R) of -0.204 and weighted average of $52,081. Similarly, the statistical analysis conducted on geographies consisting of 144,531,780 people shows no correlation between the proportion of Luxembourgers and household income with householder over the age of 65 in the United States with a correlation coefficient (R) of -0.007 and weighted average of $60,967, a difference of 17.1%.
Householder Income Over 65 years Correlation Summary
| Measurement | Native/Alaskan | Luxembourger |
| Minimum | $19,554 | $25,694 |
| Maximum | $78,193 | $87,788 |
| Range | $58,639 | $62,094 |
| Mean | $45,041 | $55,236 |
| Median | $44,466 | $56,900 |
| Interquartile 25% (IQ1) | $39,545 | $49,298 |
| Interquartile 75% (IQ3) | $51,398 | $64,744 |
| Interquartile Range (IQR) | $11,852 | $15,446 |
| Standard Deviation (Sample) | $9,551 | $13,616 |
| Standard Deviation (Population) | $9,526 | $13,473 |
Similar Demographics by Householder Income Over 65 years
Demographics Similar to Natives/Alaskans by Householder Income Over 65 years
In terms of householder income over 65 years, the demographic groups most similar to Natives/Alaskans are Immigrants from Nicaragua ($52,085, a difference of 0.010%), U.S. Virgin Islander ($52,072, a difference of 0.020%), Immigrants from the Azores ($52,121, a difference of 0.080%), Creek ($51,949, a difference of 0.25%), and Immigrants from St. Vincent and the Grenadines ($51,922, a difference of 0.30%).
| Demographics | Rating | Rank | Householder Income Over 65 years |
| Hispanics or Latinos | 0.0 /100 | #307 | Tragic $52,832 |
| Immigrants | Mexico | 0.0 /100 | #308 | Tragic $52,801 |
| Hondurans | 0.0 /100 | #309 | Tragic $52,634 |
| Sioux | 0.0 /100 | #310 | Tragic $52,509 |
| Seminole | 0.0 /100 | #311 | Tragic $52,373 |
| Immigrants | Azores | 0.0 /100 | #312 | Tragic $52,121 |
| Immigrants | Nicaragua | 0.0 /100 | #313 | Tragic $52,085 |
| Natives/Alaskans | 0.0 /100 | #314 | Tragic $52,081 |
| U.S. Virgin Islanders | 0.0 /100 | #315 | Tragic $52,072 |
| Creek | 0.0 /100 | #316 | Tragic $51,949 |
| Immigrants | St. Vincent and the Grenadines | 0.0 /100 | #317 | Tragic $51,922 |
| Haitians | 0.0 /100 | #318 | Tragic $51,912 |
| Immigrants | Honduras | 0.0 /100 | #319 | Tragic $51,888 |
| Colville | 0.0 /100 | #320 | Tragic $51,739 |
| Menominee | 0.0 /100 | #321 | Tragic $51,719 |
Demographics Similar to Luxembourgers by Householder Income Over 65 years
In terms of householder income over 65 years, the demographic groups most similar to Luxembourgers are Immigrants from Micronesia ($61,000, a difference of 0.050%), Immigrants from Poland ($61,041, a difference of 0.12%), Inupiat ($61,061, a difference of 0.15%), Spaniard ($60,866, a difference of 0.17%), and Serbian ($61,087, a difference of 0.20%).
| Demographics | Rating | Rank | Householder Income Over 65 years |
| Norwegians | 53.6 /100 | #167 | Average $61,104 |
| Irish | 53.4 /100 | #168 | Average $61,097 |
| Carpatho Rusyns | 53.3 /100 | #169 | Average $61,093 |
| Serbians | 53.1 /100 | #170 | Average $61,087 |
| Inupiat | 52.4 /100 | #171 | Average $61,061 |
| Immigrants | Poland | 51.9 /100 | #172 | Average $61,041 |
| Immigrants | Micronesia | 50.8 /100 | #173 | Average $61,000 |
| Luxembourgers | 50.0 /100 | #174 | Average $60,967 |
| Spaniards | 47.3 /100 | #175 | Average $60,866 |
| Spanish | 45.5 /100 | #176 | Average $60,795 |
| Alaska Natives | 44.3 /100 | #177 | Average $60,748 |
| Yup'ik | 43.7 /100 | #178 | Average $60,727 |
| Welsh | 42.2 /100 | #179 | Average $60,666 |
| Immigrants | Morocco | 41.7 /100 | #180 | Average $60,647 |
| Celtics | 40.7 /100 | #181 | Average $60,608 |