Native/Alaskan vs Norwegian Householder Income Over 65 years
COMPARE
Native/Alaskan
Norwegian
Householder Income Over 65 years
Householder Income Over 65 years Comparison
Natives/Alaskans
Norwegians
$52,081
HOUSEHOLDER INCOME OVER 65 YEARS
0.0/ 100
METRIC RATING
314th/ 347
METRIC RANK
$61,104
HOUSEHOLDER INCOME OVER 65 YEARS
53.6/ 100
METRIC RATING
167th/ 347
METRIC RANK
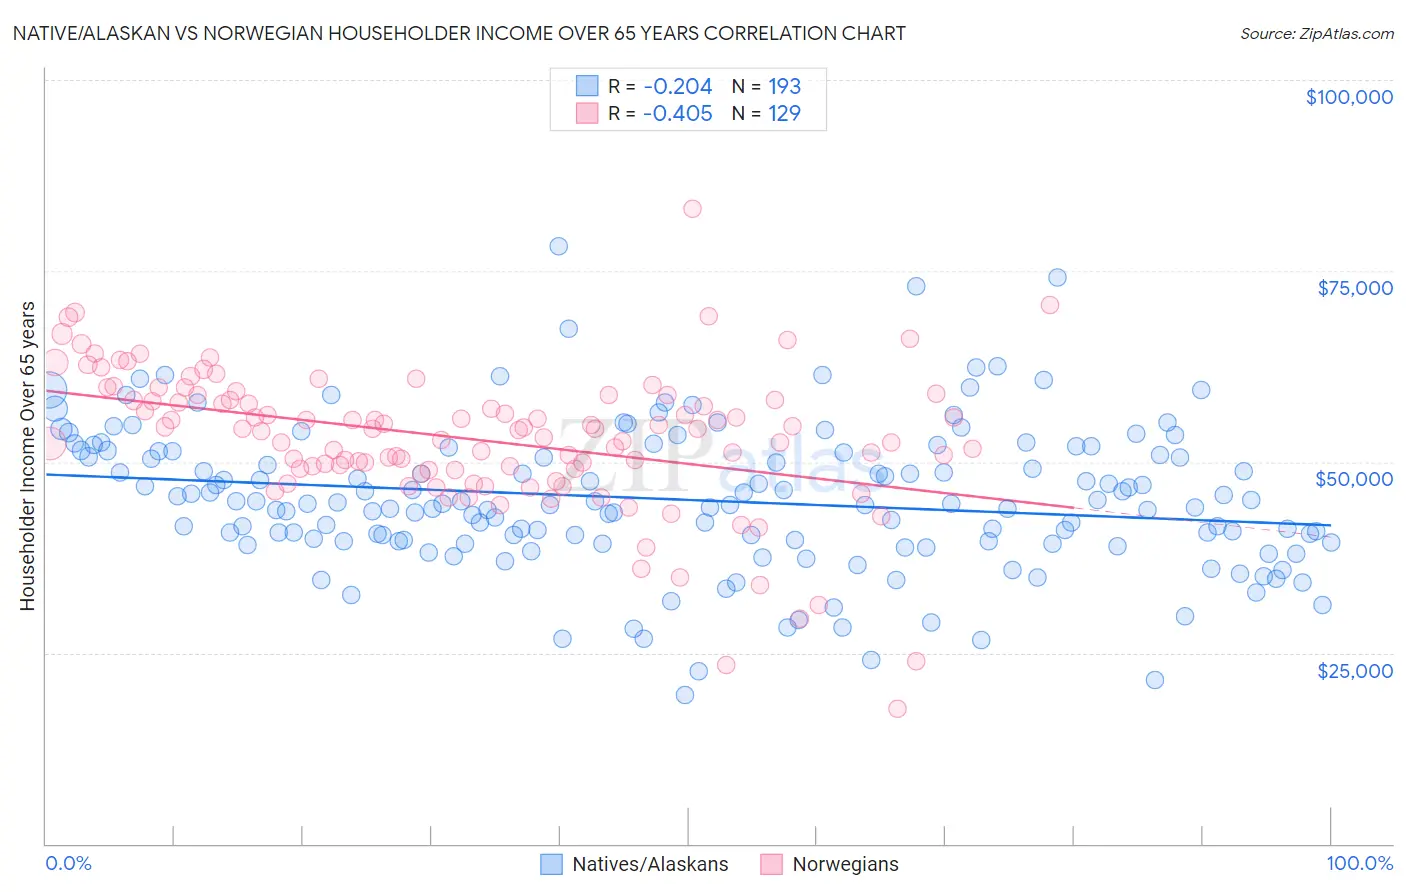
Native/Alaskan vs Norwegian Householder Income Over 65 years Correlation Chart
The statistical analysis conducted on geographies consisting of 509,572,105 people shows a weak negative correlation between the proportion of Natives/Alaskans and household income with householder over the age of 65 in the United States with a correlation coefficient (R) of -0.204 and weighted average of $52,081. Similarly, the statistical analysis conducted on geographies consisting of 529,627,922 people shows a moderate negative correlation between the proportion of Norwegians and household income with householder over the age of 65 in the United States with a correlation coefficient (R) of -0.405 and weighted average of $61,104, a difference of 17.3%.
Householder Income Over 65 years Correlation Summary
| Measurement | Native/Alaskan | Norwegian |
| Minimum | $19,554 | $17,624 |
| Maximum | $78,193 | $83,083 |
| Range | $58,639 | $65,458 |
| Mean | $45,041 | $53,000 |
| Median | $44,466 | $54,270 |
| Interquartile 25% (IQ1) | $39,545 | $49,000 |
| Interquartile 75% (IQ3) | $51,398 | $58,423 |
| Interquartile Range (IQR) | $11,852 | $9,422 |
| Standard Deviation (Sample) | $9,551 | $9,391 |
| Standard Deviation (Population) | $9,526 | $9,355 |
Similar Demographics by Householder Income Over 65 years
Demographics Similar to Natives/Alaskans by Householder Income Over 65 years
In terms of householder income over 65 years, the demographic groups most similar to Natives/Alaskans are Immigrants from Nicaragua ($52,085, a difference of 0.010%), U.S. Virgin Islander ($52,072, a difference of 0.020%), Immigrants from the Azores ($52,121, a difference of 0.080%), Creek ($51,949, a difference of 0.25%), and Immigrants from St. Vincent and the Grenadines ($51,922, a difference of 0.30%).
| Demographics | Rating | Rank | Householder Income Over 65 years |
| Hispanics or Latinos | 0.0 /100 | #307 | Tragic $52,832 |
| Immigrants | Mexico | 0.0 /100 | #308 | Tragic $52,801 |
| Hondurans | 0.0 /100 | #309 | Tragic $52,634 |
| Sioux | 0.0 /100 | #310 | Tragic $52,509 |
| Seminole | 0.0 /100 | #311 | Tragic $52,373 |
| Immigrants | Azores | 0.0 /100 | #312 | Tragic $52,121 |
| Immigrants | Nicaragua | 0.0 /100 | #313 | Tragic $52,085 |
| Natives/Alaskans | 0.0 /100 | #314 | Tragic $52,081 |
| U.S. Virgin Islanders | 0.0 /100 | #315 | Tragic $52,072 |
| Creek | 0.0 /100 | #316 | Tragic $51,949 |
| Immigrants | St. Vincent and the Grenadines | 0.0 /100 | #317 | Tragic $51,922 |
| Haitians | 0.0 /100 | #318 | Tragic $51,912 |
| Immigrants | Honduras | 0.0 /100 | #319 | Tragic $51,888 |
| Colville | 0.0 /100 | #320 | Tragic $51,739 |
| Menominee | 0.0 /100 | #321 | Tragic $51,719 |
Demographics Similar to Norwegians by Householder Income Over 65 years
In terms of householder income over 65 years, the demographic groups most similar to Norwegians are Irish ($61,097, a difference of 0.010%), Carpatho Rusyn ($61,093, a difference of 0.020%), Serbian ($61,087, a difference of 0.030%), Inupiat ($61,061, a difference of 0.070%), and Immigrants from Eastern Africa ($61,157, a difference of 0.090%).
| Demographics | Rating | Rank | Householder Income Over 65 years |
| Portuguese | 62.1 /100 | #160 | Good $61,440 |
| Icelanders | 57.9 /100 | #161 | Average $61,270 |
| Czechs | 57.2 /100 | #162 | Average $61,244 |
| Ugandans | 55.5 /100 | #163 | Average $61,177 |
| Immigrants | North Macedonia | 55.4 /100 | #164 | Average $61,175 |
| Immigrants | Ukraine | 55.1 /100 | #165 | Average $61,163 |
| Immigrants | Eastern Africa | 55.0 /100 | #166 | Average $61,157 |
| Norwegians | 53.6 /100 | #167 | Average $61,104 |
| Irish | 53.4 /100 | #168 | Average $61,097 |
| Carpatho Rusyns | 53.3 /100 | #169 | Average $61,093 |
| Serbians | 53.1 /100 | #170 | Average $61,087 |
| Inupiat | 52.4 /100 | #171 | Average $61,061 |
| Immigrants | Poland | 51.9 /100 | #172 | Average $61,041 |
| Immigrants | Micronesia | 50.8 /100 | #173 | Average $61,000 |
| Luxembourgers | 50.0 /100 | #174 | Average $60,967 |