Latvian vs Luxembourger Householder Income Over 65 years
COMPARE
Latvian
Luxembourger
Householder Income Over 65 years
Householder Income Over 65 years Comparison
Latvians
Luxembourgers
$67,326
HOUSEHOLDER INCOME OVER 65 YEARS
99.9/ 100
METRIC RATING
43rd/ 347
METRIC RANK
$60,967
HOUSEHOLDER INCOME OVER 65 YEARS
50.0/ 100
METRIC RATING
174th/ 347
METRIC RANK
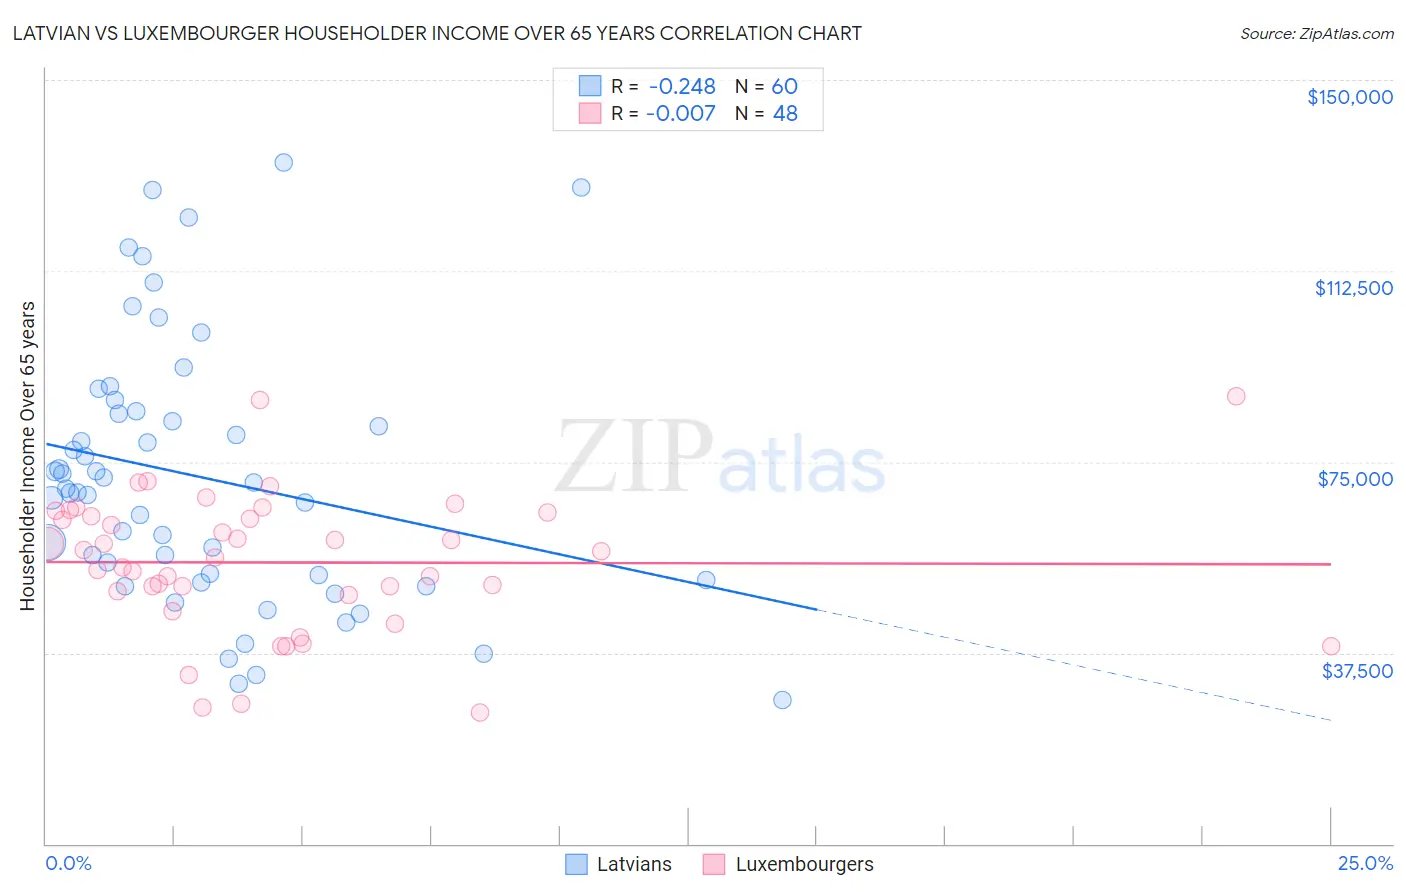
Latvian vs Luxembourger Householder Income Over 65 years Correlation Chart
The statistical analysis conducted on geographies consisting of 220,279,935 people shows a weak negative correlation between the proportion of Latvians and household income with householder over the age of 65 in the United States with a correlation coefficient (R) of -0.248 and weighted average of $67,326. Similarly, the statistical analysis conducted on geographies consisting of 144,531,780 people shows no correlation between the proportion of Luxembourgers and household income with householder over the age of 65 in the United States with a correlation coefficient (R) of -0.007 and weighted average of $60,967, a difference of 10.4%.
Householder Income Over 65 years Correlation Summary
| Measurement | Latvian | Luxembourger |
| Minimum | $28,148 | $25,694 |
| Maximum | $133,874 | $87,788 |
| Range | $105,726 | $62,094 |
| Mean | $71,961 | $55,236 |
| Median | $69,364 | $56,900 |
| Interquartile 25% (IQ1) | $52,318 | $49,298 |
| Interquartile 75% (IQ3) | $84,761 | $64,744 |
| Interquartile Range (IQR) | $32,443 | $15,446 |
| Standard Deviation (Sample) | $25,745 | $13,616 |
| Standard Deviation (Population) | $25,529 | $13,473 |
Similar Demographics by Householder Income Over 65 years
Demographics Similar to Latvians by Householder Income Over 65 years
In terms of householder income over 65 years, the demographic groups most similar to Latvians are New Zealander ($67,333, a difference of 0.010%), Immigrants from South Africa ($67,234, a difference of 0.14%), Korean ($67,472, a difference of 0.22%), Immigrants from Asia ($67,594, a difference of 0.40%), and Russian ($67,626, a difference of 0.45%).
| Demographics | Rating | Rank | Householder Income Over 65 years |
| Immigrants | Austria | 99.9 /100 | #36 | Exceptional $68,208 |
| Turks | 99.9 /100 | #37 | Exceptional $68,037 |
| Estonians | 99.9 /100 | #38 | Exceptional $67,926 |
| Russians | 99.9 /100 | #39 | Exceptional $67,626 |
| Immigrants | Asia | 99.9 /100 | #40 | Exceptional $67,594 |
| Koreans | 99.9 /100 | #41 | Exceptional $67,472 |
| New Zealanders | 99.9 /100 | #42 | Exceptional $67,333 |
| Latvians | 99.9 /100 | #43 | Exceptional $67,326 |
| Immigrants | South Africa | 99.9 /100 | #44 | Exceptional $67,234 |
| Immigrants | Afghanistan | 99.8 /100 | #45 | Exceptional $67,007 |
| Cambodians | 99.8 /100 | #46 | Exceptional $66,892 |
| Australians | 99.8 /100 | #47 | Exceptional $66,891 |
| Immigrants | France | 99.8 /100 | #48 | Exceptional $66,826 |
| Immigrants | Indonesia | 99.8 /100 | #49 | Exceptional $66,694 |
| Immigrants | Turkey | 99.7 /100 | #50 | Exceptional $66,672 |
Demographics Similar to Luxembourgers by Householder Income Over 65 years
In terms of householder income over 65 years, the demographic groups most similar to Luxembourgers are Immigrants from Micronesia ($61,000, a difference of 0.050%), Immigrants from Poland ($61,041, a difference of 0.12%), Inupiat ($61,061, a difference of 0.15%), Spaniard ($60,866, a difference of 0.17%), and Serbian ($61,087, a difference of 0.20%).
| Demographics | Rating | Rank | Householder Income Over 65 years |
| Norwegians | 53.6 /100 | #167 | Average $61,104 |
| Irish | 53.4 /100 | #168 | Average $61,097 |
| Carpatho Rusyns | 53.3 /100 | #169 | Average $61,093 |
| Serbians | 53.1 /100 | #170 | Average $61,087 |
| Inupiat | 52.4 /100 | #171 | Average $61,061 |
| Immigrants | Poland | 51.9 /100 | #172 | Average $61,041 |
| Immigrants | Micronesia | 50.8 /100 | #173 | Average $61,000 |
| Luxembourgers | 50.0 /100 | #174 | Average $60,967 |
| Spaniards | 47.3 /100 | #175 | Average $60,866 |
| Spanish | 45.5 /100 | #176 | Average $60,795 |
| Alaska Natives | 44.3 /100 | #177 | Average $60,748 |
| Yup'ik | 43.7 /100 | #178 | Average $60,727 |
| Welsh | 42.2 /100 | #179 | Average $60,666 |
| Immigrants | Morocco | 41.7 /100 | #180 | Average $60,647 |
| Celtics | 40.7 /100 | #181 | Average $60,608 |