Native/Alaskan vs Lithuanian Householder Income Over 65 years
COMPARE
Native/Alaskan
Lithuanian
Householder Income Over 65 years
Householder Income Over 65 years Comparison
Natives/Alaskans
Lithuanians
$52,081
HOUSEHOLDER INCOME OVER 65 YEARS
0.0/ 100
METRIC RATING
314th/ 347
METRIC RANK
$65,209
HOUSEHOLDER INCOME OVER 65 YEARS
98.8/ 100
METRIC RATING
74th/ 347
METRIC RANK
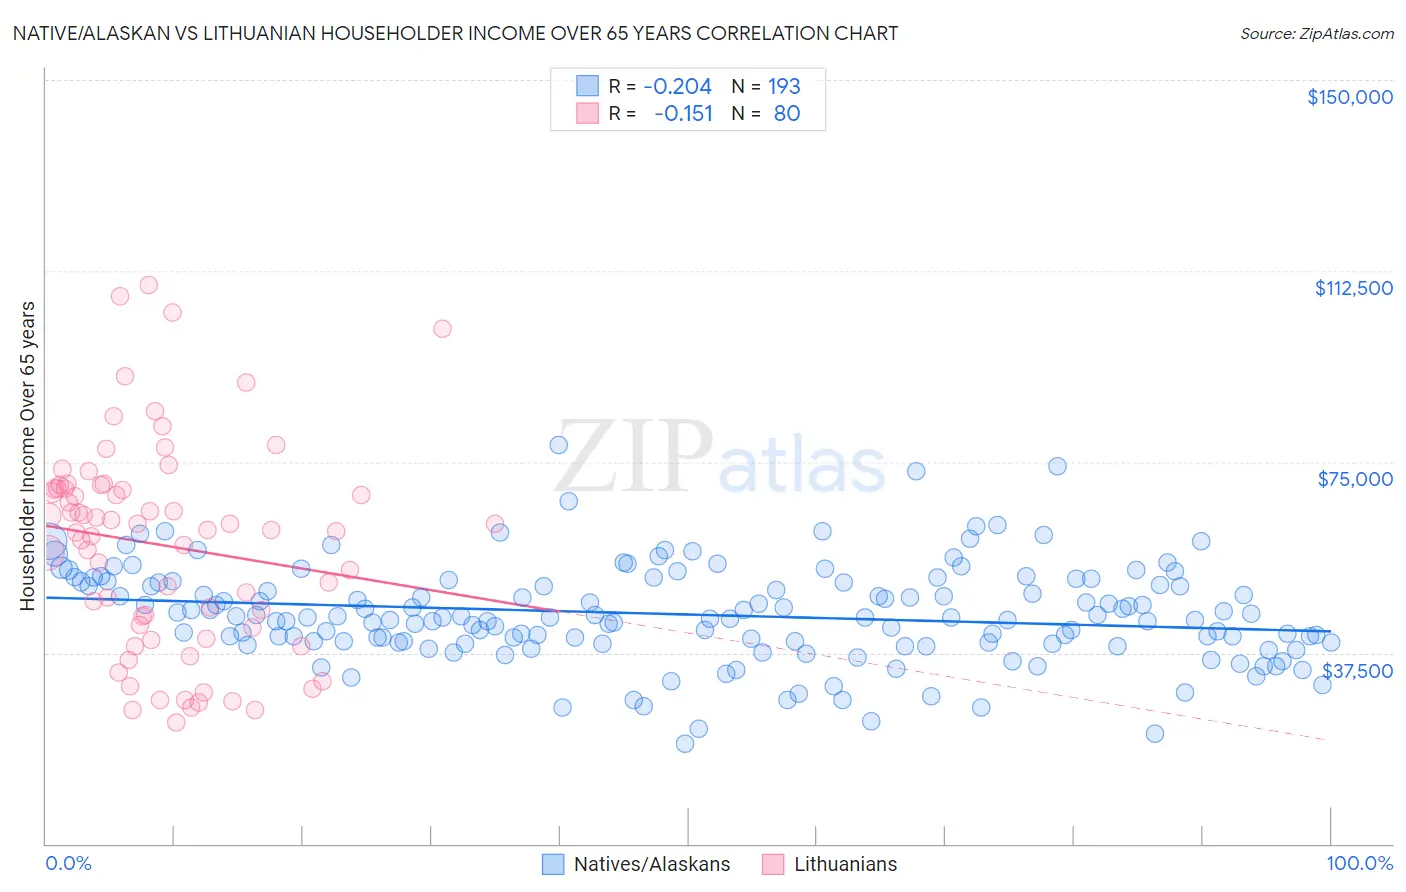
Native/Alaskan vs Lithuanian Householder Income Over 65 years Correlation Chart
The statistical analysis conducted on geographies consisting of 509,572,105 people shows a weak negative correlation between the proportion of Natives/Alaskans and household income with householder over the age of 65 in the United States with a correlation coefficient (R) of -0.204 and weighted average of $52,081. Similarly, the statistical analysis conducted on geographies consisting of 420,649,673 people shows a poor negative correlation between the proportion of Lithuanians and household income with householder over the age of 65 in the United States with a correlation coefficient (R) of -0.151 and weighted average of $65,209, a difference of 25.2%.
Householder Income Over 65 years Correlation Summary
| Measurement | Native/Alaskan | Lithuanian |
| Minimum | $19,554 | $23,920 |
| Maximum | $78,193 | $109,815 |
| Range | $58,639 | $85,895 |
| Mean | $45,041 | $58,554 |
| Median | $44,466 | $61,584 |
| Interquartile 25% (IQ1) | $39,545 | $42,717 |
| Interquartile 75% (IQ3) | $51,398 | $69,714 |
| Interquartile Range (IQR) | $11,852 | $26,997 |
| Standard Deviation (Sample) | $9,551 | $20,286 |
| Standard Deviation (Population) | $9,526 | $20,159 |
Similar Demographics by Householder Income Over 65 years
Demographics Similar to Natives/Alaskans by Householder Income Over 65 years
In terms of householder income over 65 years, the demographic groups most similar to Natives/Alaskans are Immigrants from Nicaragua ($52,085, a difference of 0.010%), U.S. Virgin Islander ($52,072, a difference of 0.020%), Immigrants from the Azores ($52,121, a difference of 0.080%), Creek ($51,949, a difference of 0.25%), and Immigrants from St. Vincent and the Grenadines ($51,922, a difference of 0.30%).
| Demographics | Rating | Rank | Householder Income Over 65 years |
| Hispanics or Latinos | 0.0 /100 | #307 | Tragic $52,832 |
| Immigrants | Mexico | 0.0 /100 | #308 | Tragic $52,801 |
| Hondurans | 0.0 /100 | #309 | Tragic $52,634 |
| Sioux | 0.0 /100 | #310 | Tragic $52,509 |
| Seminole | 0.0 /100 | #311 | Tragic $52,373 |
| Immigrants | Azores | 0.0 /100 | #312 | Tragic $52,121 |
| Immigrants | Nicaragua | 0.0 /100 | #313 | Tragic $52,085 |
| Natives/Alaskans | 0.0 /100 | #314 | Tragic $52,081 |
| U.S. Virgin Islanders | 0.0 /100 | #315 | Tragic $52,072 |
| Creek | 0.0 /100 | #316 | Tragic $51,949 |
| Immigrants | St. Vincent and the Grenadines | 0.0 /100 | #317 | Tragic $51,922 |
| Haitians | 0.0 /100 | #318 | Tragic $51,912 |
| Immigrants | Honduras | 0.0 /100 | #319 | Tragic $51,888 |
| Colville | 0.0 /100 | #320 | Tragic $51,739 |
| Menominee | 0.0 /100 | #321 | Tragic $51,719 |
Demographics Similar to Lithuanians by Householder Income Over 65 years
In terms of householder income over 65 years, the demographic groups most similar to Lithuanians are Immigrants from Ethiopia ($65,238, a difference of 0.040%), Argentinean ($65,246, a difference of 0.060%), Greek ($65,306, a difference of 0.15%), Mongolian ($65,326, a difference of 0.18%), and Sierra Leonean ($65,038, a difference of 0.26%).
| Demographics | Rating | Rank | Householder Income Over 65 years |
| Immigrants | Malaysia | 99.1 /100 | #67 | Exceptional $65,497 |
| Egyptians | 99.1 /100 | #68 | Exceptional $65,441 |
| Samoans | 99.1 /100 | #69 | Exceptional $65,427 |
| Mongolians | 99.0 /100 | #70 | Exceptional $65,326 |
| Greeks | 98.9 /100 | #71 | Exceptional $65,306 |
| Argentineans | 98.9 /100 | #72 | Exceptional $65,246 |
| Immigrants | Ethiopia | 98.9 /100 | #73 | Exceptional $65,238 |
| Lithuanians | 98.8 /100 | #74 | Exceptional $65,209 |
| Sierra Leoneans | 98.6 /100 | #75 | Exceptional $65,038 |
| Ethiopians | 98.5 /100 | #76 | Exceptional $64,989 |
| Immigrants | Canada | 98.5 /100 | #77 | Exceptional $64,952 |
| Immigrants | Western Europe | 98.5 /100 | #78 | Exceptional $64,933 |
| Hawaiians | 98.4 /100 | #79 | Exceptional $64,920 |
| Immigrants | North America | 98.3 /100 | #80 | Exceptional $64,856 |
| Immigrants | Europe | 98.3 /100 | #81 | Exceptional $64,828 |