Native/Alaskan vs Estonian Householder Income Over 65 years
COMPARE
Native/Alaskan
Estonian
Householder Income Over 65 years
Householder Income Over 65 years Comparison
Natives/Alaskans
Estonians
$52,081
HOUSEHOLDER INCOME OVER 65 YEARS
0.0/ 100
METRIC RATING
314th/ 347
METRIC RANK
$67,926
HOUSEHOLDER INCOME OVER 65 YEARS
99.9/ 100
METRIC RATING
38th/ 347
METRIC RANK
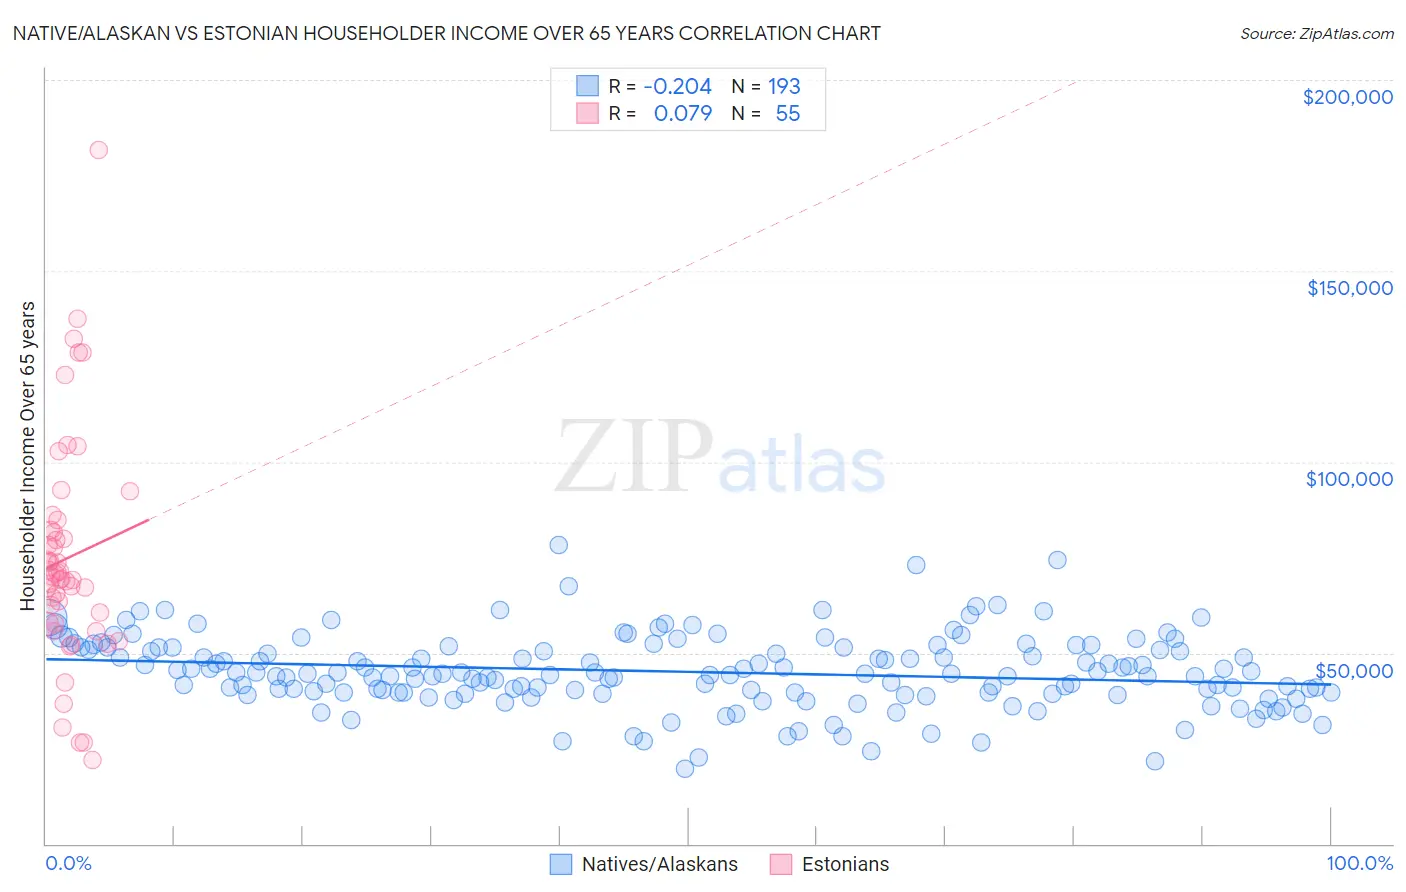
Native/Alaskan vs Estonian Householder Income Over 65 years Correlation Chart
The statistical analysis conducted on geographies consisting of 509,572,105 people shows a weak negative correlation between the proportion of Natives/Alaskans and household income with householder over the age of 65 in the United States with a correlation coefficient (R) of -0.204 and weighted average of $52,081. Similarly, the statistical analysis conducted on geographies consisting of 123,423,480 people shows a slight positive correlation between the proportion of Estonians and household income with householder over the age of 65 in the United States with a correlation coefficient (R) of 0.079 and weighted average of $67,926, a difference of 30.4%.
Householder Income Over 65 years Correlation Summary
| Measurement | Native/Alaskan | Estonian |
| Minimum | $19,554 | $21,786 |
| Maximum | $78,193 | $181,719 |
| Range | $58,639 | $159,933 |
| Mean | $45,041 | $74,728 |
| Median | $44,466 | $70,115 |
| Interquartile 25% (IQ1) | $39,545 | $57,743 |
| Interquartile 75% (IQ3) | $51,398 | $82,145 |
| Interquartile Range (IQR) | $11,852 | $24,401 |
| Standard Deviation (Sample) | $9,551 | $29,421 |
| Standard Deviation (Population) | $9,526 | $29,152 |
Similar Demographics by Householder Income Over 65 years
Demographics Similar to Natives/Alaskans by Householder Income Over 65 years
In terms of householder income over 65 years, the demographic groups most similar to Natives/Alaskans are Immigrants from Nicaragua ($52,085, a difference of 0.010%), U.S. Virgin Islander ($52,072, a difference of 0.020%), Immigrants from the Azores ($52,121, a difference of 0.080%), Creek ($51,949, a difference of 0.25%), and Immigrants from St. Vincent and the Grenadines ($51,922, a difference of 0.30%).
| Demographics | Rating | Rank | Householder Income Over 65 years |
| Hispanics or Latinos | 0.0 /100 | #307 | Tragic $52,832 |
| Immigrants | Mexico | 0.0 /100 | #308 | Tragic $52,801 |
| Hondurans | 0.0 /100 | #309 | Tragic $52,634 |
| Sioux | 0.0 /100 | #310 | Tragic $52,509 |
| Seminole | 0.0 /100 | #311 | Tragic $52,373 |
| Immigrants | Azores | 0.0 /100 | #312 | Tragic $52,121 |
| Immigrants | Nicaragua | 0.0 /100 | #313 | Tragic $52,085 |
| Natives/Alaskans | 0.0 /100 | #314 | Tragic $52,081 |
| U.S. Virgin Islanders | 0.0 /100 | #315 | Tragic $52,072 |
| Creek | 0.0 /100 | #316 | Tragic $51,949 |
| Immigrants | St. Vincent and the Grenadines | 0.0 /100 | #317 | Tragic $51,922 |
| Haitians | 0.0 /100 | #318 | Tragic $51,912 |
| Immigrants | Honduras | 0.0 /100 | #319 | Tragic $51,888 |
| Colville | 0.0 /100 | #320 | Tragic $51,739 |
| Menominee | 0.0 /100 | #321 | Tragic $51,719 |
Demographics Similar to Estonians by Householder Income Over 65 years
In terms of householder income over 65 years, the demographic groups most similar to Estonians are Turkish ($68,037, a difference of 0.16%), Immigrants from Austria ($68,208, a difference of 0.42%), Russian ($67,626, a difference of 0.44%), Tongan ($68,235, a difference of 0.46%), and Immigrants from Asia ($67,594, a difference of 0.49%).
| Demographics | Rating | Rank | Householder Income Over 65 years |
| Afghans | 100.0 /100 | #31 | Exceptional $68,951 |
| Asians | 100.0 /100 | #32 | Exceptional $68,822 |
| Immigrants | Denmark | 100.0 /100 | #33 | Exceptional $68,801 |
| Immigrants | Ireland | 100.0 /100 | #34 | Exceptional $68,495 |
| Tongans | 100.0 /100 | #35 | Exceptional $68,235 |
| Immigrants | Austria | 99.9 /100 | #36 | Exceptional $68,208 |
| Turks | 99.9 /100 | #37 | Exceptional $68,037 |
| Estonians | 99.9 /100 | #38 | Exceptional $67,926 |
| Russians | 99.9 /100 | #39 | Exceptional $67,626 |
| Immigrants | Asia | 99.9 /100 | #40 | Exceptional $67,594 |
| Koreans | 99.9 /100 | #41 | Exceptional $67,472 |
| New Zealanders | 99.9 /100 | #42 | Exceptional $67,333 |
| Latvians | 99.9 /100 | #43 | Exceptional $67,326 |
| Immigrants | South Africa | 99.9 /100 | #44 | Exceptional $67,234 |
| Immigrants | Afghanistan | 99.8 /100 | #45 | Exceptional $67,007 |