Immigrants from Latvia vs Luxembourger Householder Income Over 65 years
COMPARE
Immigrants from Latvia
Luxembourger
Householder Income Over 65 years
Householder Income Over 65 years Comparison
Immigrants from Latvia
Luxembourgers
$64,298
HOUSEHOLDER INCOME OVER 65 YEARS
97.0/ 100
METRIC RATING
95th/ 347
METRIC RANK
$60,967
HOUSEHOLDER INCOME OVER 65 YEARS
50.0/ 100
METRIC RATING
174th/ 347
METRIC RANK
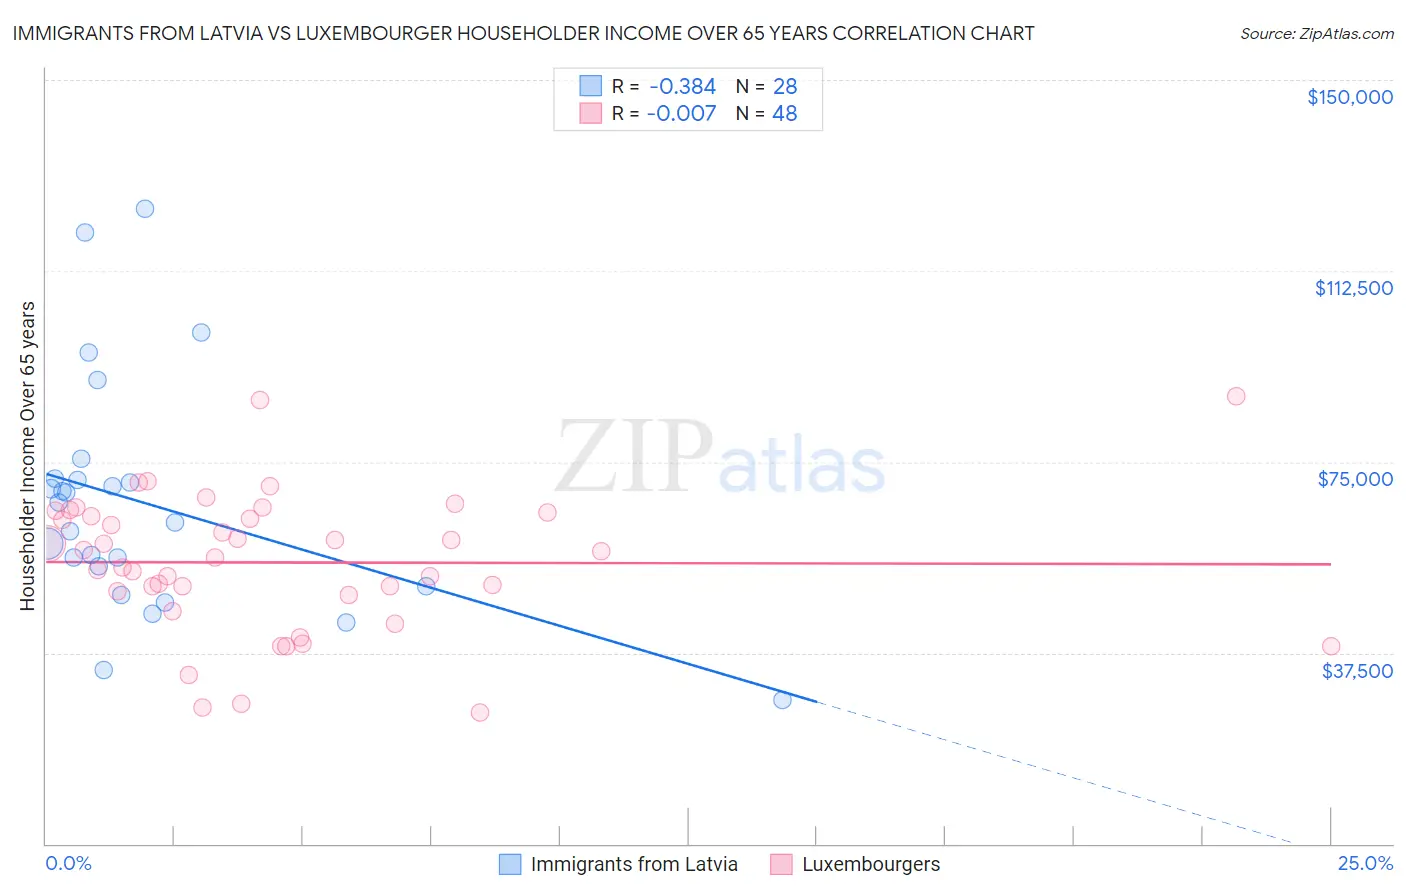
Immigrants from Latvia vs Luxembourger Householder Income Over 65 years Correlation Chart
The statistical analysis conducted on geographies consisting of 113,654,175 people shows a mild negative correlation between the proportion of Immigrants from Latvia and household income with householder over the age of 65 in the United States with a correlation coefficient (R) of -0.384 and weighted average of $64,298. Similarly, the statistical analysis conducted on geographies consisting of 144,531,780 people shows no correlation between the proportion of Luxembourgers and household income with householder over the age of 65 in the United States with a correlation coefficient (R) of -0.007 and weighted average of $60,967, a difference of 5.5%.
Householder Income Over 65 years Correlation Summary
| Measurement | Immigrants from Latvia | Luxembourger |
| Minimum | $28,148 | $25,694 |
| Maximum | $124,787 | $87,788 |
| Range | $96,639 | $62,094 |
| Mean | $66,864 | $55,236 |
| Median | $65,041 | $56,900 |
| Interquartile 25% (IQ1) | $52,525 | $49,298 |
| Interquartile 75% (IQ3) | $71,607 | $64,744 |
| Interquartile Range (IQR) | $19,082 | $15,446 |
| Standard Deviation (Sample) | $22,839 | $13,616 |
| Standard Deviation (Population) | $22,427 | $13,473 |
Similar Demographics by Householder Income Over 65 years
Demographics Similar to Immigrants from Latvia by Householder Income Over 65 years
In terms of householder income over 65 years, the demographic groups most similar to Immigrants from Latvia are Immigrants from Egypt ($64,299, a difference of 0.0%), Jordanian ($64,313, a difference of 0.020%), Immigrants from Hungary ($64,277, a difference of 0.030%), Immigrants from Bulgaria ($64,379, a difference of 0.13%), and Sri Lankan ($64,201, a difference of 0.15%).
| Demographics | Rating | Rank | Householder Income Over 65 years |
| Immigrants | Romania | 97.5 /100 | #88 | Exceptional $64,462 |
| Paraguayans | 97.4 /100 | #89 | Exceptional $64,443 |
| Immigrants | Kuwait | 97.4 /100 | #90 | Exceptional $64,433 |
| Immigrants | Oceania | 97.4 /100 | #91 | Exceptional $64,416 |
| Immigrants | Bulgaria | 97.3 /100 | #92 | Exceptional $64,379 |
| Jordanians | 97.1 /100 | #93 | Exceptional $64,313 |
| Immigrants | Egypt | 97.0 /100 | #94 | Exceptional $64,299 |
| Immigrants | Latvia | 97.0 /100 | #95 | Exceptional $64,298 |
| Immigrants | Hungary | 97.0 /100 | #96 | Exceptional $64,277 |
| Sri Lankans | 96.7 /100 | #97 | Exceptional $64,201 |
| Romanians | 96.5 /100 | #98 | Exceptional $64,142 |
| Assyrians/Chaldeans/Syriacs | 96.4 /100 | #99 | Exceptional $64,108 |
| Immigrants | South Eastern Asia | 96.3 /100 | #100 | Exceptional $64,089 |
| Immigrants | Italy | 96.2 /100 | #101 | Exceptional $64,065 |
| Chileans | 95.8 /100 | #102 | Exceptional $63,957 |
Demographics Similar to Luxembourgers by Householder Income Over 65 years
In terms of householder income over 65 years, the demographic groups most similar to Luxembourgers are Immigrants from Micronesia ($61,000, a difference of 0.050%), Immigrants from Poland ($61,041, a difference of 0.12%), Inupiat ($61,061, a difference of 0.15%), Spaniard ($60,866, a difference of 0.17%), and Serbian ($61,087, a difference of 0.20%).
| Demographics | Rating | Rank | Householder Income Over 65 years |
| Norwegians | 53.6 /100 | #167 | Average $61,104 |
| Irish | 53.4 /100 | #168 | Average $61,097 |
| Carpatho Rusyns | 53.3 /100 | #169 | Average $61,093 |
| Serbians | 53.1 /100 | #170 | Average $61,087 |
| Inupiat | 52.4 /100 | #171 | Average $61,061 |
| Immigrants | Poland | 51.9 /100 | #172 | Average $61,041 |
| Immigrants | Micronesia | 50.8 /100 | #173 | Average $61,000 |
| Luxembourgers | 50.0 /100 | #174 | Average $60,967 |
| Spaniards | 47.3 /100 | #175 | Average $60,866 |
| Spanish | 45.5 /100 | #176 | Average $60,795 |
| Alaska Natives | 44.3 /100 | #177 | Average $60,748 |
| Yup'ik | 43.7 /100 | #178 | Average $60,727 |
| Welsh | 42.2 /100 | #179 | Average $60,666 |
| Immigrants | Morocco | 41.7 /100 | #180 | Average $60,647 |
| Celtics | 40.7 /100 | #181 | Average $60,608 |