Immigrants from Micronesia vs Luxembourger Householder Income Over 65 years
COMPARE
Immigrants from Micronesia
Luxembourger
Householder Income Over 65 years
Householder Income Over 65 years Comparison
Immigrants from Micronesia
Luxembourgers
$61,000
HOUSEHOLDER INCOME OVER 65 YEARS
50.8/ 100
METRIC RATING
173rd/ 347
METRIC RANK
$60,967
HOUSEHOLDER INCOME OVER 65 YEARS
50.0/ 100
METRIC RATING
174th/ 347
METRIC RANK
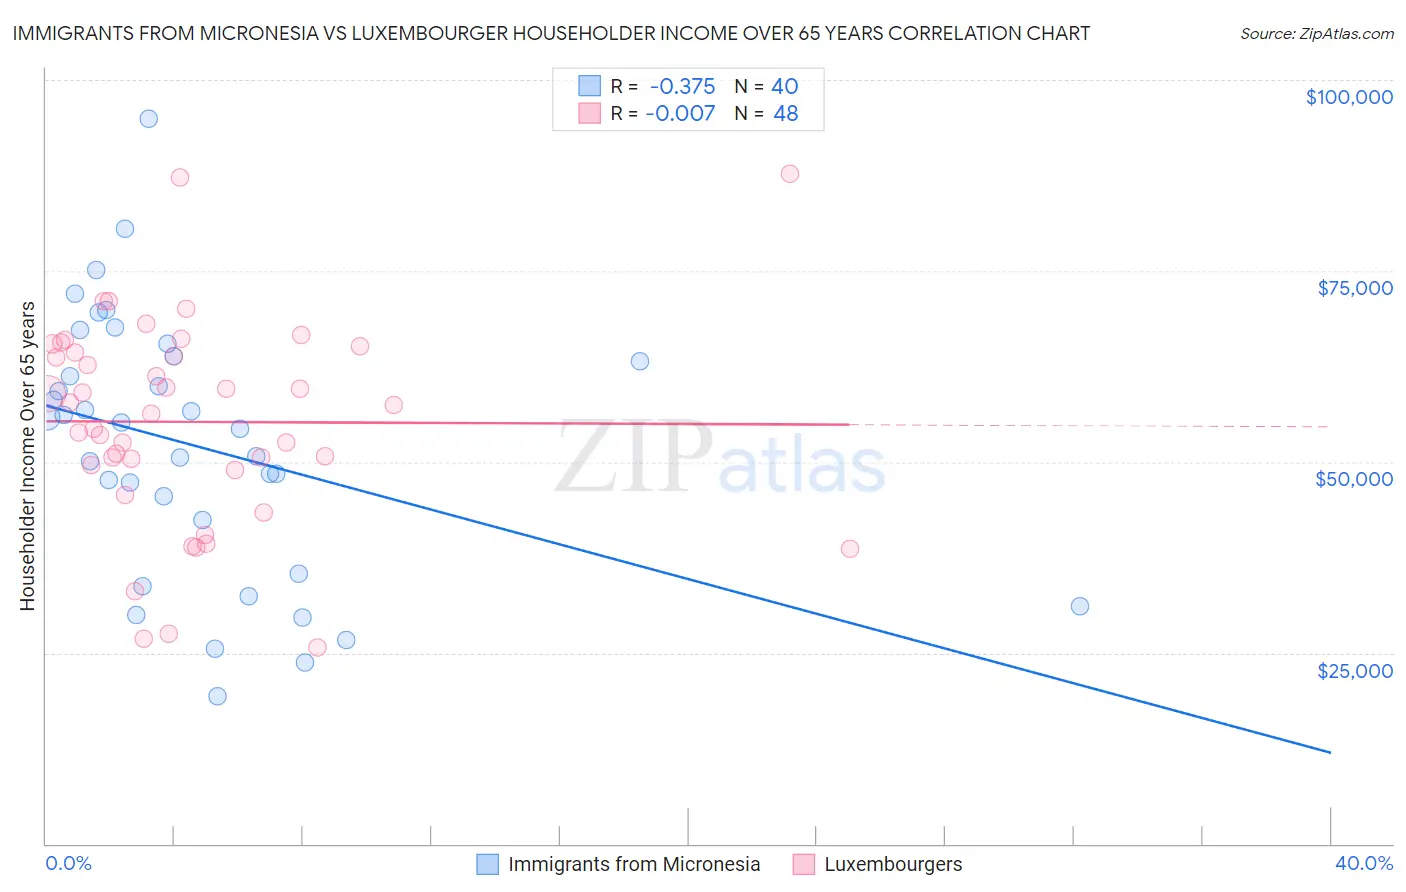
Immigrants from Micronesia vs Luxembourger Householder Income Over 65 years Correlation Chart
The statistical analysis conducted on geographies consisting of 61,368,968 people shows a mild negative correlation between the proportion of Immigrants from Micronesia and household income with householder over the age of 65 in the United States with a correlation coefficient (R) of -0.375 and weighted average of $61,000. Similarly, the statistical analysis conducted on geographies consisting of 144,531,780 people shows no correlation between the proportion of Luxembourgers and household income with householder over the age of 65 in the United States with a correlation coefficient (R) of -0.007 and weighted average of $60,967, a difference of 0.050%.
Householder Income Over 65 years Correlation Summary
| Measurement | Immigrants from Micronesia | Luxembourger |
| Minimum | $19,375 | $25,694 |
| Maximum | $94,868 | $87,788 |
| Range | $75,493 | $62,094 |
| Mean | $52,032 | $55,236 |
| Median | $54,757 | $56,900 |
| Interquartile 25% (IQ1) | $38,889 | $49,298 |
| Interquartile 75% (IQ3) | $63,458 | $64,744 |
| Interquartile Range (IQR) | $24,569 | $15,446 |
| Standard Deviation (Sample) | $17,019 | $13,616 |
| Standard Deviation (Population) | $16,805 | $13,473 |
Demographics Similar to Immigrants from Micronesia and Luxembourgers by Householder Income Over 65 years
In terms of householder income over 65 years, the demographic groups most similar to Immigrants from Micronesia are Immigrants from Poland ($61,041, a difference of 0.070%), Inupiat ($61,061, a difference of 0.10%), Serbian ($61,087, a difference of 0.14%), Carpatho Rusyn ($61,093, a difference of 0.15%), and Irish ($61,097, a difference of 0.16%). Similarly, the demographic groups most similar to Luxembourgers are Immigrants from Poland ($61,041, a difference of 0.12%), Inupiat ($61,061, a difference of 0.15%), Spaniard ($60,866, a difference of 0.17%), Serbian ($61,087, a difference of 0.20%), and Irish ($61,097, a difference of 0.21%).
| Demographics | Rating | Rank | Householder Income Over 65 years |
| Ugandans | 55.5 /100 | #163 | Average $61,177 |
| Immigrants | North Macedonia | 55.4 /100 | #164 | Average $61,175 |
| Immigrants | Ukraine | 55.1 /100 | #165 | Average $61,163 |
| Immigrants | Eastern Africa | 55.0 /100 | #166 | Average $61,157 |
| Norwegians | 53.6 /100 | #167 | Average $61,104 |
| Irish | 53.4 /100 | #168 | Average $61,097 |
| Carpatho Rusyns | 53.3 /100 | #169 | Average $61,093 |
| Serbians | 53.1 /100 | #170 | Average $61,087 |
| Inupiat | 52.4 /100 | #171 | Average $61,061 |
| Immigrants | Poland | 51.9 /100 | #172 | Average $61,041 |
| Immigrants | Micronesia | 50.8 /100 | #173 | Average $61,000 |
| Luxembourgers | 50.0 /100 | #174 | Average $60,967 |
| Spaniards | 47.3 /100 | #175 | Average $60,866 |
| Spanish | 45.5 /100 | #176 | Average $60,795 |
| Alaska Natives | 44.3 /100 | #177 | Average $60,748 |
| Yup'ik | 43.7 /100 | #178 | Average $60,727 |
| Welsh | 42.2 /100 | #179 | Average $60,666 |
| Immigrants | Morocco | 41.7 /100 | #180 | Average $60,647 |
| Celtics | 40.7 /100 | #181 | Average $60,608 |
| Czechoslovakians | 40.0 /100 | #182 | Average $60,581 |
| Kenyans | 38.4 /100 | #183 | Fair $60,514 |