Immigrants from Eritrea vs Luxembourger Householder Income Over 65 years
COMPARE
Immigrants from Eritrea
Luxembourger
Householder Income Over 65 years
Householder Income Over 65 years Comparison
Immigrants from Eritrea
Luxembourgers
$60,096
HOUSEHOLDER INCOME OVER 65 YEARS
28.6/ 100
METRIC RATING
188th/ 347
METRIC RANK
$60,967
HOUSEHOLDER INCOME OVER 65 YEARS
50.0/ 100
METRIC RATING
174th/ 347
METRIC RANK
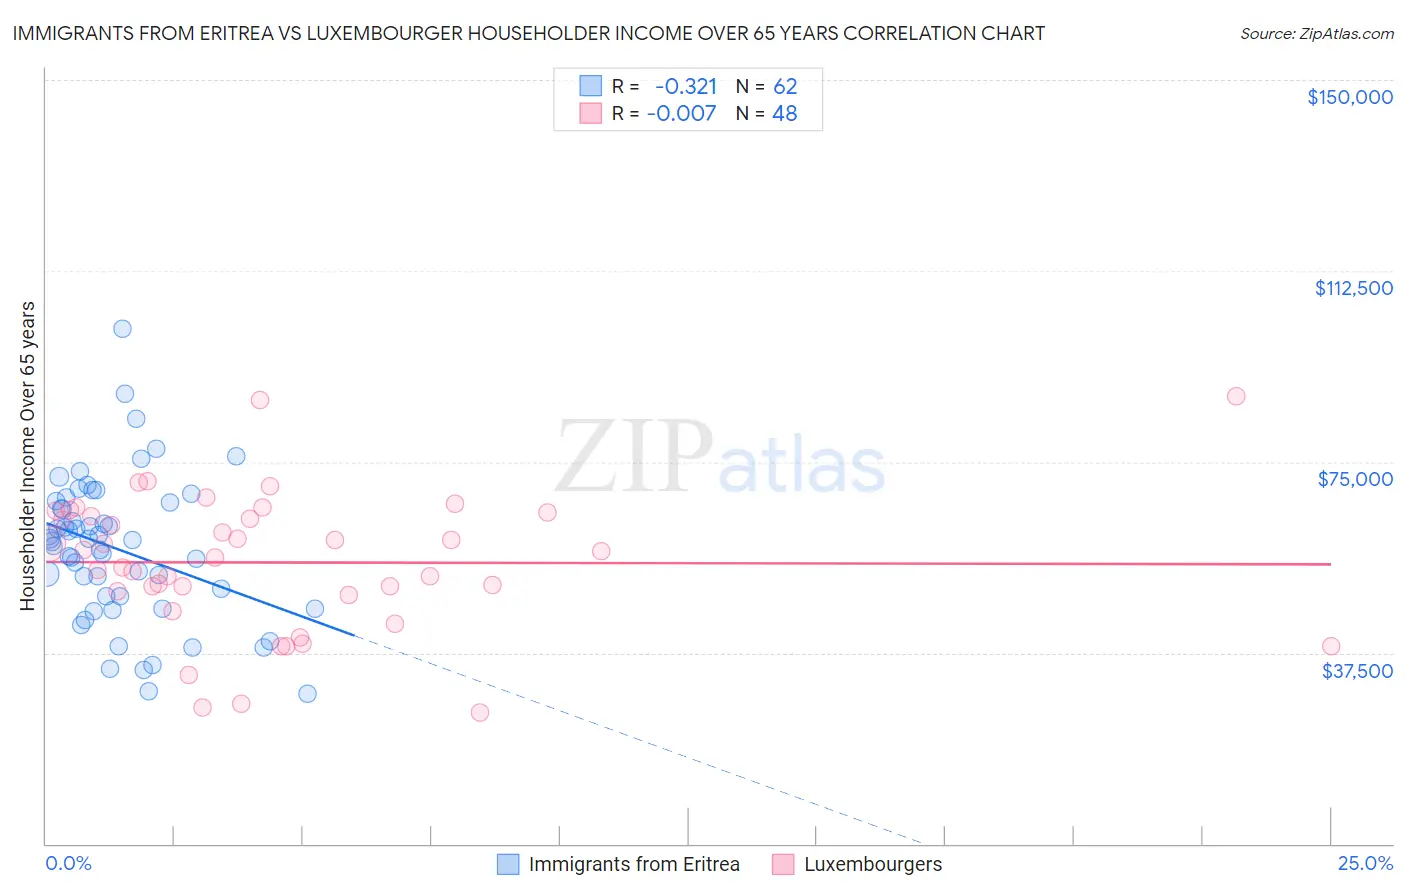
Immigrants from Eritrea vs Luxembourger Householder Income Over 65 years Correlation Chart
The statistical analysis conducted on geographies consisting of 104,821,031 people shows a mild negative correlation between the proportion of Immigrants from Eritrea and household income with householder over the age of 65 in the United States with a correlation coefficient (R) of -0.321 and weighted average of $60,096. Similarly, the statistical analysis conducted on geographies consisting of 144,531,780 people shows no correlation between the proportion of Luxembourgers and household income with householder over the age of 65 in the United States with a correlation coefficient (R) of -0.007 and weighted average of $60,967, a difference of 1.5%.
Householder Income Over 65 years Correlation Summary
| Measurement | Immigrants from Eritrea | Luxembourger |
| Minimum | $29,432 | $25,694 |
| Maximum | $101,078 | $87,788 |
| Range | $71,646 | $62,094 |
| Mean | $57,826 | $55,236 |
| Median | $59,523 | $56,900 |
| Interquartile 25% (IQ1) | $48,607 | $49,298 |
| Interquartile 75% (IQ3) | $67,083 | $64,744 |
| Interquartile Range (IQR) | $18,476 | $15,446 |
| Standard Deviation (Sample) | $14,156 | $13,616 |
| Standard Deviation (Population) | $14,041 | $13,473 |
Demographics Similar to Immigrants from Eritrea and Luxembourgers by Householder Income Over 65 years
In terms of householder income over 65 years, the demographic groups most similar to Immigrants from Eritrea are Ghanaian ($60,043, a difference of 0.090%), Immigrants from Thailand ($60,217, a difference of 0.20%), Slovene ($60,241, a difference of 0.24%), Albanian ($60,249, a difference of 0.26%), and Puget Sound Salish ($59,934, a difference of 0.27%). Similarly, the demographic groups most similar to Luxembourgers are Immigrants from Micronesia ($61,000, a difference of 0.050%), Immigrants from Poland ($61,041, a difference of 0.12%), Inupiat ($61,061, a difference of 0.15%), Spaniard ($60,866, a difference of 0.17%), and Spanish ($60,795, a difference of 0.28%).
| Demographics | Rating | Rank | Householder Income Over 65 years |
| Inupiat | 52.4 /100 | #171 | Average $61,061 |
| Immigrants | Poland | 51.9 /100 | #172 | Average $61,041 |
| Immigrants | Micronesia | 50.8 /100 | #173 | Average $61,000 |
| Luxembourgers | 50.0 /100 | #174 | Average $60,967 |
| Spaniards | 47.3 /100 | #175 | Average $60,866 |
| Spanish | 45.5 /100 | #176 | Average $60,795 |
| Alaska Natives | 44.3 /100 | #177 | Average $60,748 |
| Yup'ik | 43.7 /100 | #178 | Average $60,727 |
| Welsh | 42.2 /100 | #179 | Average $60,666 |
| Immigrants | Morocco | 41.7 /100 | #180 | Average $60,647 |
| Celtics | 40.7 /100 | #181 | Average $60,608 |
| Czechoslovakians | 40.0 /100 | #182 | Average $60,581 |
| Kenyans | 38.4 /100 | #183 | Fair $60,514 |
| Iraqis | 37.2 /100 | #184 | Fair $60,466 |
| Albanians | 32.0 /100 | #185 | Fair $60,249 |
| Slovenes | 31.8 /100 | #186 | Fair $60,241 |
| Immigrants | Thailand | 31.3 /100 | #187 | Fair $60,217 |
| Immigrants | Eritrea | 28.6 /100 | #188 | Fair $60,096 |
| Ghanaians | 27.5 /100 | #189 | Fair $60,043 |
| Puget Sound Salish | 25.3 /100 | #190 | Fair $59,934 |
| Belgians | 24.9 /100 | #191 | Fair $59,915 |