Native/Alaskan vs Senegalese Householder Income Over 65 years
COMPARE
Native/Alaskan
Senegalese
Householder Income Over 65 years
Householder Income Over 65 years Comparison
Natives/Alaskans
Senegalese
$52,081
HOUSEHOLDER INCOME OVER 65 YEARS
0.0/ 100
METRIC RATING
314th/ 347
METRIC RANK
$53,591
HOUSEHOLDER INCOME OVER 65 YEARS
0.0/ 100
METRIC RATING
294th/ 347
METRIC RANK
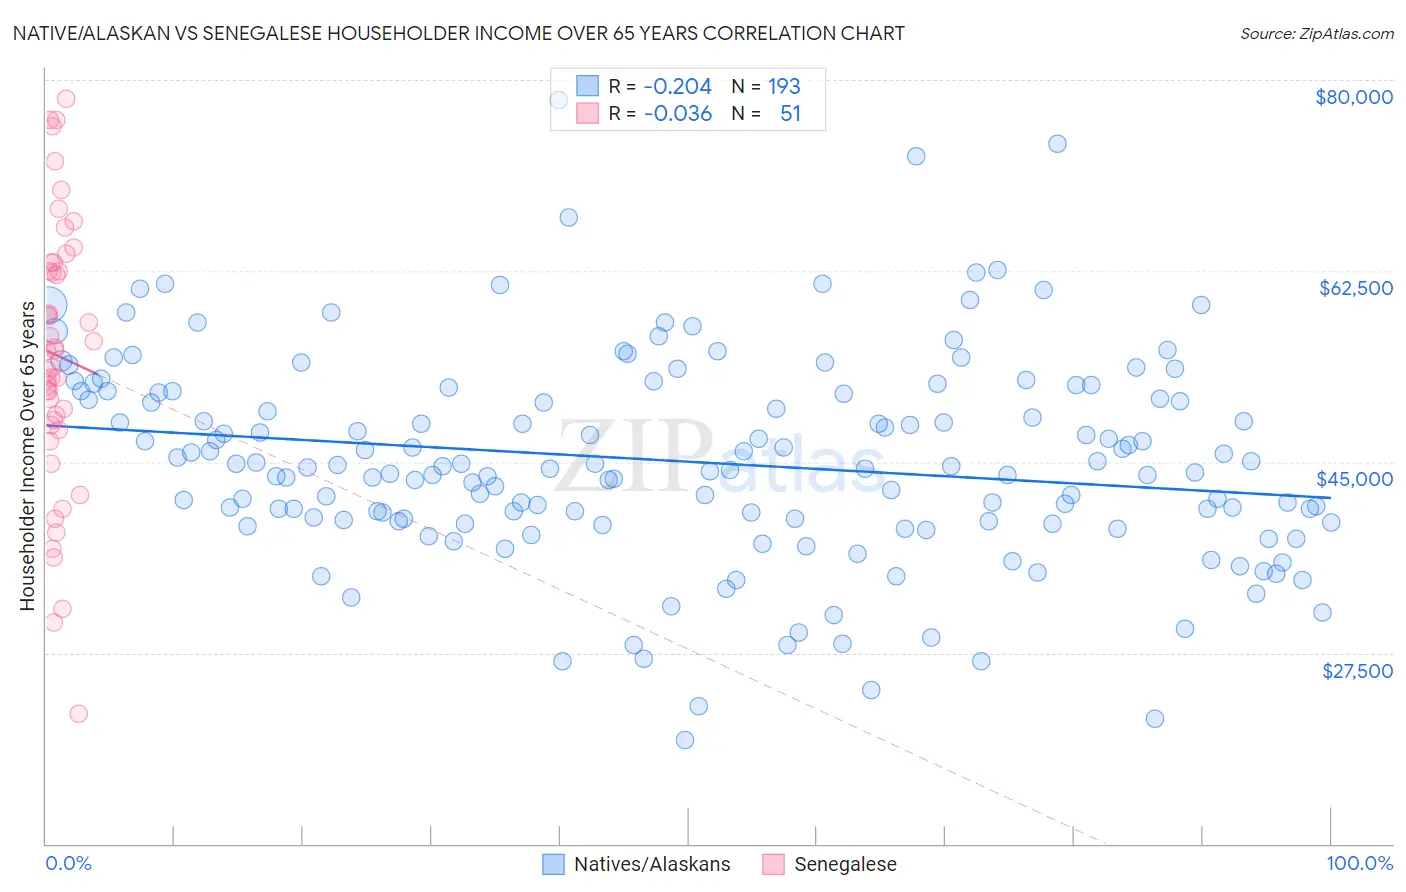
Native/Alaskan vs Senegalese Householder Income Over 65 years Correlation Chart
The statistical analysis conducted on geographies consisting of 509,572,105 people shows a weak negative correlation between the proportion of Natives/Alaskans and household income with householder over the age of 65 in the United States with a correlation coefficient (R) of -0.204 and weighted average of $52,081. Similarly, the statistical analysis conducted on geographies consisting of 78,053,259 people shows no correlation between the proportion of Senegalese and household income with householder over the age of 65 in the United States with a correlation coefficient (R) of -0.036 and weighted average of $53,591, a difference of 2.9%.
Householder Income Over 65 years Correlation Summary
| Measurement | Native/Alaskan | Senegalese |
| Minimum | $19,554 | $21,940 |
| Maximum | $78,193 | $78,302 |
| Range | $58,639 | $56,362 |
| Mean | $45,041 | $54,750 |
| Median | $44,466 | $55,203 |
| Interquartile 25% (IQ1) | $39,545 | $48,378 |
| Interquartile 75% (IQ3) | $51,398 | $63,248 |
| Interquartile Range (IQR) | $11,852 | $14,869 |
| Standard Deviation (Sample) | $9,551 | $12,398 |
| Standard Deviation (Population) | $9,526 | $12,276 |
Demographics Similar to Natives/Alaskans and Senegalese by Householder Income Over 65 years
In terms of householder income over 65 years, the demographic groups most similar to Natives/Alaskans are Immigrants from Nicaragua ($52,085, a difference of 0.010%), Immigrants from the Azores ($52,121, a difference of 0.080%), Seminole ($52,373, a difference of 0.56%), Sioux ($52,509, a difference of 0.82%), and Honduran ($52,634, a difference of 1.1%). Similarly, the demographic groups most similar to Senegalese are Immigrants from Central America ($53,420, a difference of 0.32%), Immigrants from Somalia ($53,333, a difference of 0.48%), Immigrants from Latin America ($53,265, a difference of 0.61%), Central American Indian ($53,232, a difference of 0.67%), and Ottawa ($53,217, a difference of 0.70%).
| Demographics | Rating | Rank | Householder Income Over 65 years |
| Senegalese | 0.0 /100 | #294 | Tragic $53,591 |
| Immigrants | Central America | 0.0 /100 | #295 | Tragic $53,420 |
| Immigrants | Somalia | 0.0 /100 | #296 | Tragic $53,333 |
| Immigrants | Latin America | 0.0 /100 | #297 | Tragic $53,265 |
| Central American Indians | 0.0 /100 | #298 | Tragic $53,232 |
| Ottawa | 0.0 /100 | #299 | Tragic $53,217 |
| Immigrants | Bahamas | 0.0 /100 | #300 | Tragic $53,174 |
| Yuman | 0.0 /100 | #301 | Tragic $53,110 |
| Spanish American Indians | 0.0 /100 | #302 | Tragic $53,077 |
| Choctaw | 0.0 /100 | #303 | Tragic $53,060 |
| Ute | 0.0 /100 | #304 | Tragic $52,949 |
| Pueblo | 0.0 /100 | #305 | Tragic $52,930 |
| Pennsylvania Germans | 0.0 /100 | #306 | Tragic $52,888 |
| Hispanics or Latinos | 0.0 /100 | #307 | Tragic $52,832 |
| Immigrants | Mexico | 0.0 /100 | #308 | Tragic $52,801 |
| Hondurans | 0.0 /100 | #309 | Tragic $52,634 |
| Sioux | 0.0 /100 | #310 | Tragic $52,509 |
| Seminole | 0.0 /100 | #311 | Tragic $52,373 |
| Immigrants | Azores | 0.0 /100 | #312 | Tragic $52,121 |
| Immigrants | Nicaragua | 0.0 /100 | #313 | Tragic $52,085 |
| Natives/Alaskans | 0.0 /100 | #314 | Tragic $52,081 |