South African vs Luxembourger Householder Income Over 65 years
COMPARE
South African
Luxembourger
Householder Income Over 65 years
Householder Income Over 65 years Comparison
South Africans
Luxembourgers
$65,652
HOUSEHOLDER INCOME OVER 65 YEARS
99.3/ 100
METRIC RATING
66th/ 347
METRIC RANK
$60,967
HOUSEHOLDER INCOME OVER 65 YEARS
50.0/ 100
METRIC RATING
174th/ 347
METRIC RANK
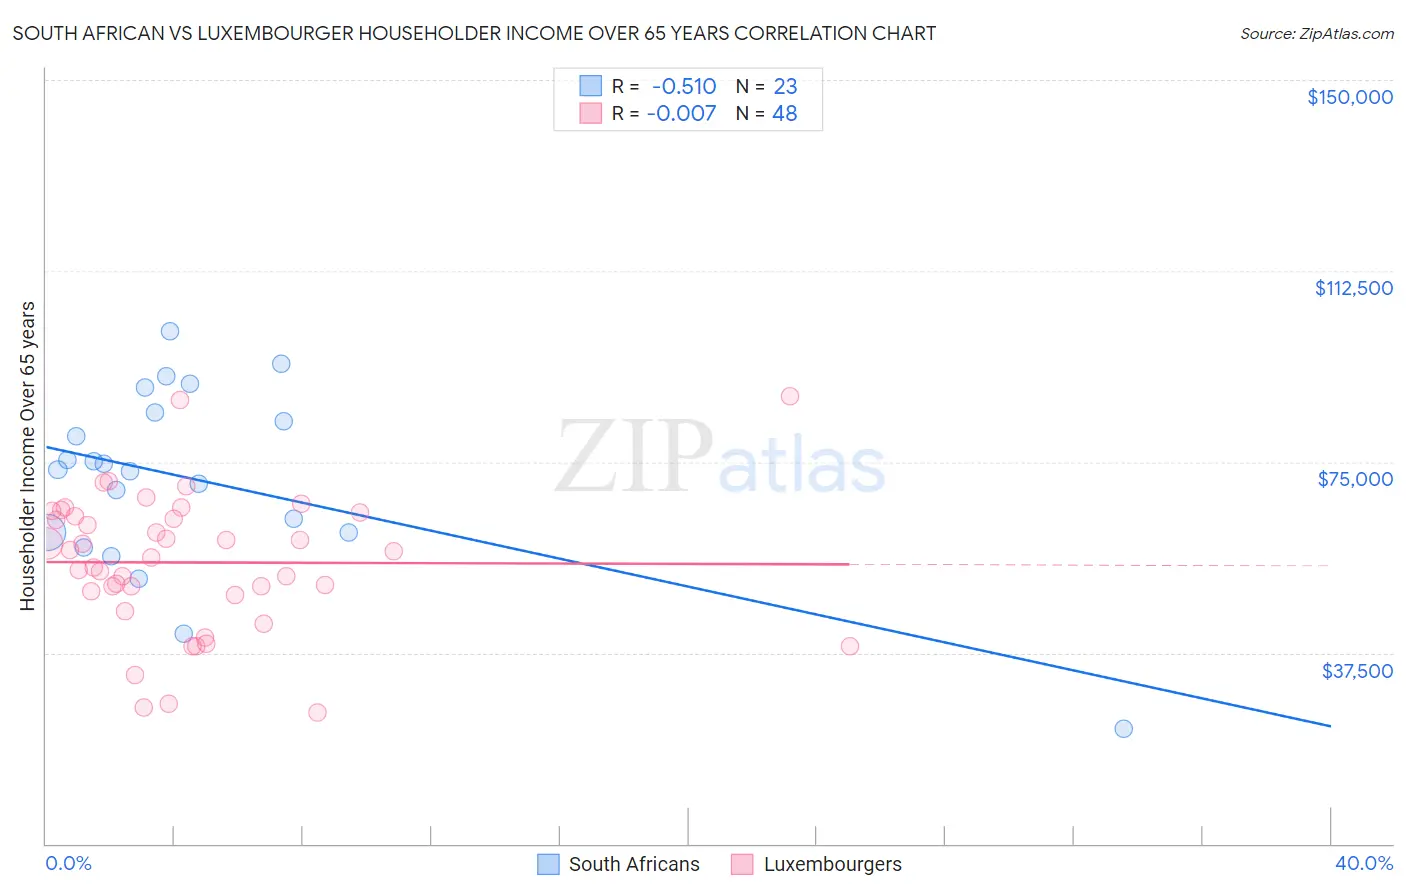
South African vs Luxembourger Householder Income Over 65 years Correlation Chart
The statistical analysis conducted on geographies consisting of 182,279,663 people shows a substantial negative correlation between the proportion of South Africans and household income with householder over the age of 65 in the United States with a correlation coefficient (R) of -0.510 and weighted average of $65,652. Similarly, the statistical analysis conducted on geographies consisting of 144,531,780 people shows no correlation between the proportion of Luxembourgers and household income with householder over the age of 65 in the United States with a correlation coefficient (R) of -0.007 and weighted average of $60,967, a difference of 7.7%.
Householder Income Over 65 years Correlation Summary
| Measurement | South African | Luxembourger |
| Minimum | $22,500 | $25,694 |
| Maximum | $100,655 | $87,788 |
| Range | $78,155 | $62,094 |
| Mean | $71,429 | $55,236 |
| Median | $73,431 | $56,900 |
| Interquartile 25% (IQ1) | $61,016 | $49,298 |
| Interquartile 75% (IQ3) | $84,692 | $64,744 |
| Interquartile Range (IQR) | $23,677 | $15,446 |
| Standard Deviation (Sample) | $18,184 | $13,616 |
| Standard Deviation (Population) | $17,784 | $13,473 |
Similar Demographics by Householder Income Over 65 years
Demographics Similar to South Africans by Householder Income Over 65 years
In terms of householder income over 65 years, the demographic groups most similar to South Africans are Immigrants from England ($65,715, a difference of 0.10%), Immigrants from Malaysia ($65,497, a difference of 0.24%), Zimbabwean ($65,854, a difference of 0.31%), Egyptian ($65,441, a difference of 0.32%), and Marshallese ($65,874, a difference of 0.34%).
| Demographics | Rating | Rank | Householder Income Over 65 years |
| Immigrants | Norway | 99.5 /100 | #59 | Exceptional $66,118 |
| Immigrants | Lithuania | 99.5 /100 | #60 | Exceptional $66,087 |
| Maltese | 99.5 /100 | #61 | Exceptional $66,027 |
| Immigrants | Sierra Leone | 99.5 /100 | #62 | Exceptional $66,009 |
| Marshallese | 99.4 /100 | #63 | Exceptional $65,874 |
| Zimbabweans | 99.4 /100 | #64 | Exceptional $65,854 |
| Immigrants | England | 99.3 /100 | #65 | Exceptional $65,715 |
| South Africans | 99.3 /100 | #66 | Exceptional $65,652 |
| Immigrants | Malaysia | 99.1 /100 | #67 | Exceptional $65,497 |
| Egyptians | 99.1 /100 | #68 | Exceptional $65,441 |
| Samoans | 99.1 /100 | #69 | Exceptional $65,427 |
| Mongolians | 99.0 /100 | #70 | Exceptional $65,326 |
| Greeks | 98.9 /100 | #71 | Exceptional $65,306 |
| Argentineans | 98.9 /100 | #72 | Exceptional $65,246 |
| Immigrants | Ethiopia | 98.9 /100 | #73 | Exceptional $65,238 |
Demographics Similar to Luxembourgers by Householder Income Over 65 years
In terms of householder income over 65 years, the demographic groups most similar to Luxembourgers are Immigrants from Micronesia ($61,000, a difference of 0.050%), Immigrants from Poland ($61,041, a difference of 0.12%), Inupiat ($61,061, a difference of 0.15%), Spaniard ($60,866, a difference of 0.17%), and Serbian ($61,087, a difference of 0.20%).
| Demographics | Rating | Rank | Householder Income Over 65 years |
| Norwegians | 53.6 /100 | #167 | Average $61,104 |
| Irish | 53.4 /100 | #168 | Average $61,097 |
| Carpatho Rusyns | 53.3 /100 | #169 | Average $61,093 |
| Serbians | 53.1 /100 | #170 | Average $61,087 |
| Inupiat | 52.4 /100 | #171 | Average $61,061 |
| Immigrants | Poland | 51.9 /100 | #172 | Average $61,041 |
| Immigrants | Micronesia | 50.8 /100 | #173 | Average $61,000 |
| Luxembourgers | 50.0 /100 | #174 | Average $60,967 |
| Spaniards | 47.3 /100 | #175 | Average $60,866 |
| Spanish | 45.5 /100 | #176 | Average $60,795 |
| Alaska Natives | 44.3 /100 | #177 | Average $60,748 |
| Yup'ik | 43.7 /100 | #178 | Average $60,727 |
| Welsh | 42.2 /100 | #179 | Average $60,666 |
| Immigrants | Morocco | 41.7 /100 | #180 | Average $60,647 |
| Celtics | 40.7 /100 | #181 | Average $60,608 |