Native/Alaskan vs Immigrants from Italy Householder Income Over 65 years
COMPARE
Native/Alaskan
Immigrants from Italy
Householder Income Over 65 years
Householder Income Over 65 years Comparison
Natives/Alaskans
Immigrants from Italy
$52,081
HOUSEHOLDER INCOME OVER 65 YEARS
0.0/ 100
METRIC RATING
314th/ 347
METRIC RANK
$64,065
HOUSEHOLDER INCOME OVER 65 YEARS
96.2/ 100
METRIC RATING
101st/ 347
METRIC RANK
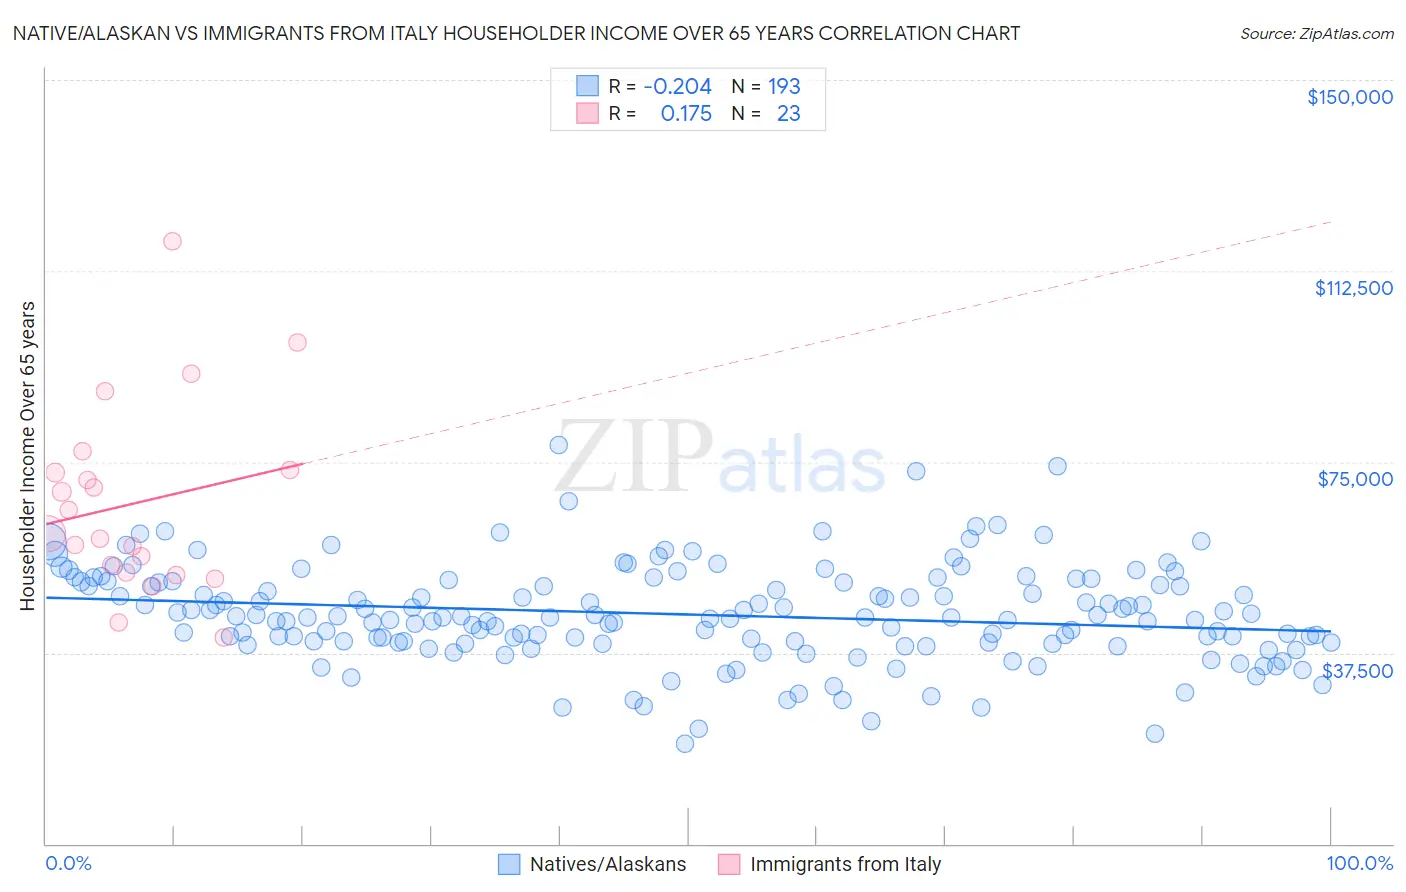
Native/Alaskan vs Immigrants from Italy Householder Income Over 65 years Correlation Chart
The statistical analysis conducted on geographies consisting of 509,572,105 people shows a weak negative correlation between the proportion of Natives/Alaskans and household income with householder over the age of 65 in the United States with a correlation coefficient (R) of -0.204 and weighted average of $52,081. Similarly, the statistical analysis conducted on geographies consisting of 323,658,132 people shows a poor positive correlation between the proportion of Immigrants from Italy and household income with householder over the age of 65 in the United States with a correlation coefficient (R) of 0.175 and weighted average of $64,065, a difference of 23.0%.
Householder Income Over 65 years Correlation Summary
| Measurement | Native/Alaskan | Immigrants from Italy |
| Minimum | $19,554 | $40,625 |
| Maximum | $78,193 | $118,263 |
| Range | $58,639 | $77,638 |
| Mean | $45,041 | $66,915 |
| Median | $44,466 | $60,782 |
| Interquartile 25% (IQ1) | $39,545 | $53,273 |
| Interquartile 75% (IQ3) | $51,398 | $73,333 |
| Interquartile Range (IQR) | $11,852 | $20,060 |
| Standard Deviation (Sample) | $9,551 | $18,554 |
| Standard Deviation (Population) | $9,526 | $18,146 |
Similar Demographics by Householder Income Over 65 years
Demographics Similar to Natives/Alaskans by Householder Income Over 65 years
In terms of householder income over 65 years, the demographic groups most similar to Natives/Alaskans are Immigrants from Nicaragua ($52,085, a difference of 0.010%), U.S. Virgin Islander ($52,072, a difference of 0.020%), Immigrants from the Azores ($52,121, a difference of 0.080%), Creek ($51,949, a difference of 0.25%), and Immigrants from St. Vincent and the Grenadines ($51,922, a difference of 0.30%).
| Demographics | Rating | Rank | Householder Income Over 65 years |
| Hispanics or Latinos | 0.0 /100 | #307 | Tragic $52,832 |
| Immigrants | Mexico | 0.0 /100 | #308 | Tragic $52,801 |
| Hondurans | 0.0 /100 | #309 | Tragic $52,634 |
| Sioux | 0.0 /100 | #310 | Tragic $52,509 |
| Seminole | 0.0 /100 | #311 | Tragic $52,373 |
| Immigrants | Azores | 0.0 /100 | #312 | Tragic $52,121 |
| Immigrants | Nicaragua | 0.0 /100 | #313 | Tragic $52,085 |
| Natives/Alaskans | 0.0 /100 | #314 | Tragic $52,081 |
| U.S. Virgin Islanders | 0.0 /100 | #315 | Tragic $52,072 |
| Creek | 0.0 /100 | #316 | Tragic $51,949 |
| Immigrants | St. Vincent and the Grenadines | 0.0 /100 | #317 | Tragic $51,922 |
| Haitians | 0.0 /100 | #318 | Tragic $51,912 |
| Immigrants | Honduras | 0.0 /100 | #319 | Tragic $51,888 |
| Colville | 0.0 /100 | #320 | Tragic $51,739 |
| Menominee | 0.0 /100 | #321 | Tragic $51,719 |
Demographics Similar to Immigrants from Italy by Householder Income Over 65 years
In terms of householder income over 65 years, the demographic groups most similar to Immigrants from Italy are Immigrants from South Eastern Asia ($64,089, a difference of 0.040%), Assyrian/Chaldean/Syriac ($64,108, a difference of 0.070%), Romanian ($64,142, a difference of 0.12%), Chilean ($63,957, a difference of 0.17%), and British ($63,940, a difference of 0.20%).
| Demographics | Rating | Rank | Householder Income Over 65 years |
| Immigrants | Egypt | 97.0 /100 | #94 | Exceptional $64,299 |
| Immigrants | Latvia | 97.0 /100 | #95 | Exceptional $64,298 |
| Immigrants | Hungary | 97.0 /100 | #96 | Exceptional $64,277 |
| Sri Lankans | 96.7 /100 | #97 | Exceptional $64,201 |
| Romanians | 96.5 /100 | #98 | Exceptional $64,142 |
| Assyrians/Chaldeans/Syriacs | 96.4 /100 | #99 | Exceptional $64,108 |
| Immigrants | South Eastern Asia | 96.3 /100 | #100 | Exceptional $64,089 |
| Immigrants | Italy | 96.2 /100 | #101 | Exceptional $64,065 |
| Chileans | 95.8 /100 | #102 | Exceptional $63,957 |
| British | 95.7 /100 | #103 | Exceptional $63,940 |
| Immigrants | Cameroon | 95.6 /100 | #104 | Exceptional $63,907 |
| Italians | 95.5 /100 | #105 | Exceptional $63,885 |
| Immigrants | Argentina | 95.5 /100 | #106 | Exceptional $63,885 |
| Pakistanis | 95.3 /100 | #107 | Exceptional $63,844 |
| Palestinians | 95.1 /100 | #108 | Exceptional $63,800 |