Native/Alaskan vs Lithuanian 4th Grade
COMPARE
Native/Alaskan
Lithuanian
4th Grade
4th Grade Comparison
Natives/Alaskans
Lithuanians
97.4%
4TH GRADE
20.6/ 100
METRIC RATING
199th/ 347
METRIC RANK
98.3%
4TH GRADE
100.0/ 100
METRIC RATING
21st/ 347
METRIC RANK
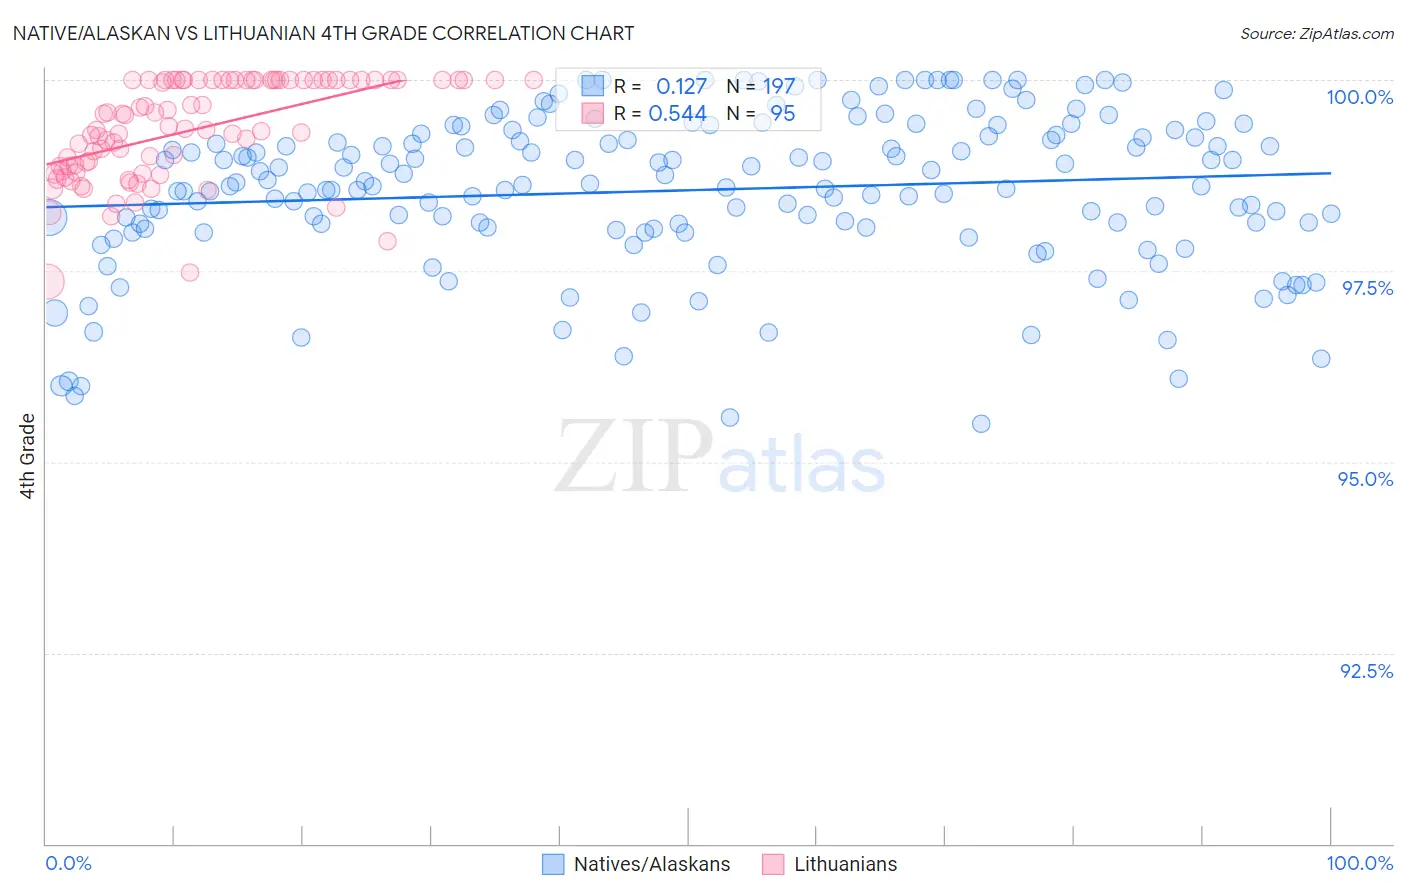
Native/Alaskan vs Lithuanian 4th Grade Correlation Chart
The statistical analysis conducted on geographies consisting of 513,056,654 people shows a poor positive correlation between the proportion of Natives/Alaskans and percentage of population with at least 4th grade education in the United States with a correlation coefficient (R) of 0.127 and weighted average of 97.4%. Similarly, the statistical analysis conducted on geographies consisting of 421,946,231 people shows a substantial positive correlation between the proportion of Lithuanians and percentage of population with at least 4th grade education in the United States with a correlation coefficient (R) of 0.544 and weighted average of 98.3%, a difference of 0.98%.
4th Grade Correlation Summary
| Measurement | Native/Alaskan | Lithuanian |
| Minimum | 95.5% | 97.4% |
| Maximum | 100.0% | 100.0% |
| Range | 4.5% | 2.6% |
| Mean | 98.6% | 99.3% |
| Median | 98.6% | 99.4% |
| Interquartile 25% (IQ1) | 98.1% | 98.8% |
| Interquartile 75% (IQ3) | 99.3% | 100.0% |
| Interquartile Range (IQR) | 1.2% | 1.2% |
| Standard Deviation (Sample) | 1.0% | 0.65% |
| Standard Deviation (Population) | 1.0% | 0.65% |
Similar Demographics by 4th Grade
Demographics Similar to Natives/Alaskans by 4th Grade
In terms of 4th grade, the demographic groups most similar to Natives/Alaskans are Guamanian/Chamorro (97.4%, a difference of 0.010%), Immigrants from Uganda (97.4%, a difference of 0.010%), Hawaiian (97.4%, a difference of 0.030%), Immigrants from Southern Europe (97.4%, a difference of 0.030%), and Immigrants from Chile (97.4%, a difference of 0.030%).
| Demographics | Rating | Rank | 4th Grade |
| Immigrants | Ukraine | 30.1 /100 | #192 | Fair 97.4% |
| Immigrants | Egypt | 30.1 /100 | #193 | Fair 97.4% |
| Portuguese | 29.2 /100 | #194 | Fair 97.4% |
| Paraguayans | 28.9 /100 | #195 | Fair 97.4% |
| Immigrants | Albania | 27.7 /100 | #196 | Fair 97.4% |
| Hawaiians | 25.6 /100 | #197 | Fair 97.4% |
| Guamanians/Chamorros | 23.0 /100 | #198 | Fair 97.4% |
| Natives/Alaskans | 20.6 /100 | #199 | Fair 97.4% |
| Immigrants | Uganda | 19.8 /100 | #200 | Poor 97.4% |
| Immigrants | Southern Europe | 16.2 /100 | #201 | Poor 97.4% |
| Immigrants | Chile | 16.1 /100 | #202 | Poor 97.4% |
| Immigrants | Northern Africa | 15.1 /100 | #203 | Poor 97.4% |
| Africans | 14.6 /100 | #204 | Poor 97.4% |
| Paiute | 13.2 /100 | #205 | Poor 97.3% |
| Immigrants | Zaire | 12.8 /100 | #206 | Poor 97.3% |
Demographics Similar to Lithuanians by 4th Grade
In terms of 4th grade, the demographic groups most similar to Lithuanians are Finnish (98.3%, a difference of 0.0%), Irish (98.4%, a difference of 0.010%), Alaska Native (98.4%, a difference of 0.010%), Polish (98.4%, a difference of 0.020%), and Sioux (98.3%, a difference of 0.020%).
| Demographics | Rating | Rank | 4th Grade |
| Carpatho Rusyns | 100.0 /100 | #14 | Exceptional 98.4% |
| Dutch | 100.0 /100 | #15 | Exceptional 98.4% |
| Scottish | 100.0 /100 | #16 | Exceptional 98.4% |
| Pennsylvania Germans | 100.0 /100 | #17 | Exceptional 98.4% |
| Poles | 100.0 /100 | #18 | Exceptional 98.4% |
| Irish | 100.0 /100 | #19 | Exceptional 98.4% |
| Alaska Natives | 100.0 /100 | #20 | Exceptional 98.4% |
| Lithuanians | 100.0 /100 | #21 | Exceptional 98.3% |
| Finns | 100.0 /100 | #22 | Exceptional 98.3% |
| Sioux | 100.0 /100 | #23 | Exceptional 98.3% |
| Danes | 100.0 /100 | #24 | Exceptional 98.3% |
| Scotch-Irish | 100.0 /100 | #25 | Exceptional 98.3% |
| Croatians | 100.0 /100 | #26 | Exceptional 98.3% |
| French Canadians | 100.0 /100 | #27 | Exceptional 98.3% |
| French | 100.0 /100 | #28 | Exceptional 98.3% |