Samoan vs Lithuanian Householder Income Over 65 years
COMPARE
Samoan
Lithuanian
Householder Income Over 65 years
Householder Income Over 65 years Comparison
Samoans
Lithuanians
$65,427
HOUSEHOLDER INCOME OVER 65 YEARS
99.1/ 100
METRIC RATING
69th/ 347
METRIC RANK
$65,209
HOUSEHOLDER INCOME OVER 65 YEARS
98.8/ 100
METRIC RATING
74th/ 347
METRIC RANK
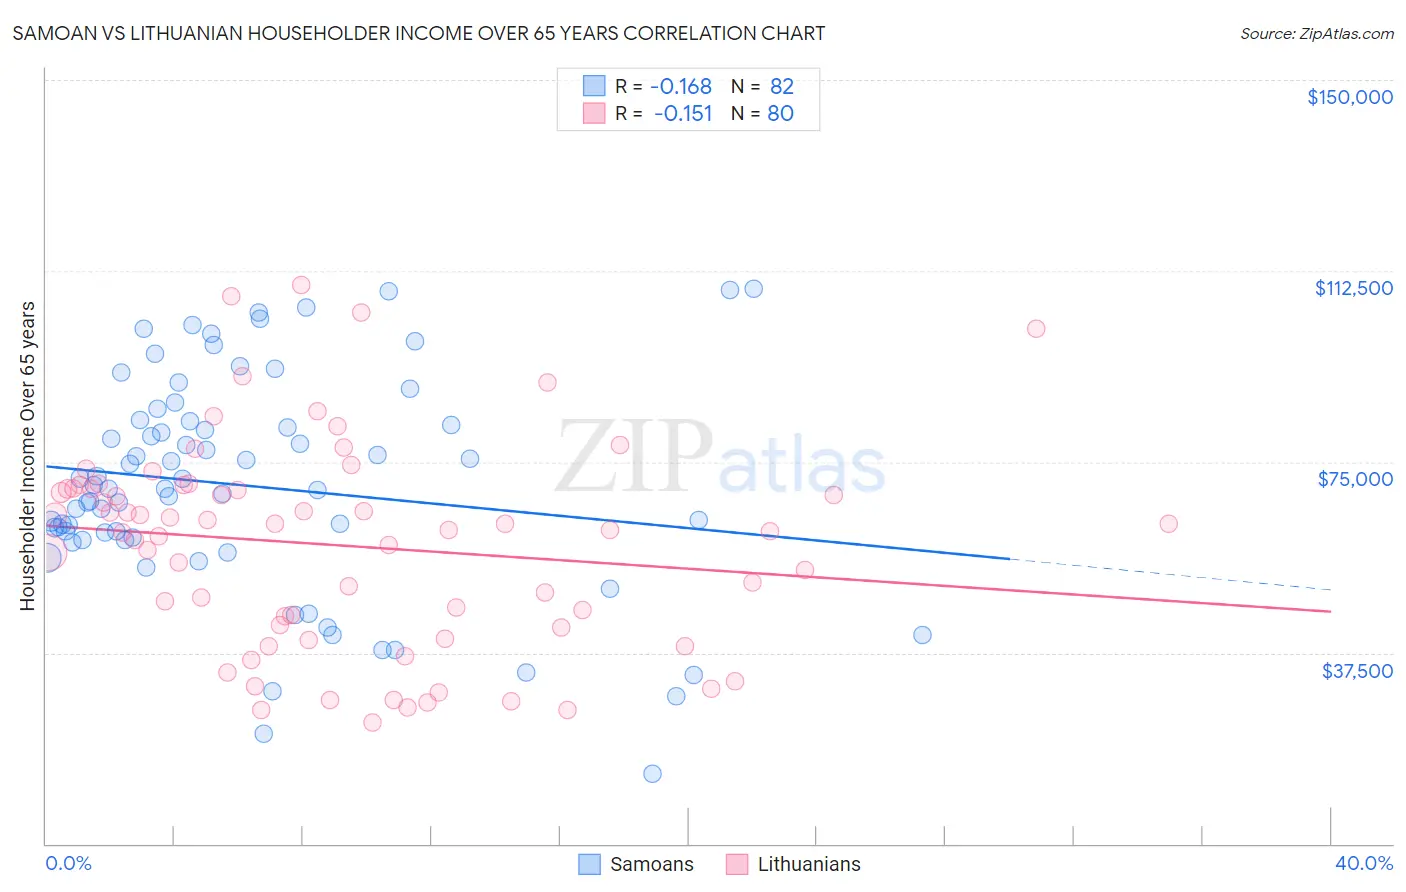
Samoan vs Lithuanian Householder Income Over 65 years Correlation Chart
The statistical analysis conducted on geographies consisting of 224,404,839 people shows a poor negative correlation between the proportion of Samoans and household income with householder over the age of 65 in the United States with a correlation coefficient (R) of -0.168 and weighted average of $65,427. Similarly, the statistical analysis conducted on geographies consisting of 420,649,673 people shows a poor negative correlation between the proportion of Lithuanians and household income with householder over the age of 65 in the United States with a correlation coefficient (R) of -0.151 and weighted average of $65,209, a difference of 0.33%.
Householder Income Over 65 years Correlation Summary
| Measurement | Samoan | Lithuanian |
| Minimum | $13,651 | $23,920 |
| Maximum | $108,977 | $109,815 |
| Range | $95,326 | $85,895 |
| Mean | $70,206 | $58,554 |
| Median | $69,618 | $61,584 |
| Interquartile 25% (IQ1) | $59,611 | $42,717 |
| Interquartile 75% (IQ3) | $83,086 | $69,714 |
| Interquartile Range (IQR) | $23,475 | $26,997 |
| Standard Deviation (Sample) | $21,405 | $20,286 |
| Standard Deviation (Population) | $21,274 | $20,159 |
Demographics Similar to Samoans and Lithuanians by Householder Income Over 65 years
In terms of householder income over 65 years, the demographic groups most similar to Samoans are Egyptian ($65,441, a difference of 0.020%), Immigrants from Malaysia ($65,497, a difference of 0.11%), Mongolian ($65,326, a difference of 0.15%), Greek ($65,306, a difference of 0.19%), and Argentinean ($65,246, a difference of 0.28%). Similarly, the demographic groups most similar to Lithuanians are Immigrants from Ethiopia ($65,238, a difference of 0.040%), Argentinean ($65,246, a difference of 0.060%), Greek ($65,306, a difference of 0.15%), Mongolian ($65,326, a difference of 0.18%), and Sierra Leonean ($65,038, a difference of 0.26%).
| Demographics | Rating | Rank | Householder Income Over 65 years |
| Maltese | 99.5 /100 | #61 | Exceptional $66,027 |
| Immigrants | Sierra Leone | 99.5 /100 | #62 | Exceptional $66,009 |
| Marshallese | 99.4 /100 | #63 | Exceptional $65,874 |
| Zimbabweans | 99.4 /100 | #64 | Exceptional $65,854 |
| Immigrants | England | 99.3 /100 | #65 | Exceptional $65,715 |
| South Africans | 99.3 /100 | #66 | Exceptional $65,652 |
| Immigrants | Malaysia | 99.1 /100 | #67 | Exceptional $65,497 |
| Egyptians | 99.1 /100 | #68 | Exceptional $65,441 |
| Samoans | 99.1 /100 | #69 | Exceptional $65,427 |
| Mongolians | 99.0 /100 | #70 | Exceptional $65,326 |
| Greeks | 98.9 /100 | #71 | Exceptional $65,306 |
| Argentineans | 98.9 /100 | #72 | Exceptional $65,246 |
| Immigrants | Ethiopia | 98.9 /100 | #73 | Exceptional $65,238 |
| Lithuanians | 98.8 /100 | #74 | Exceptional $65,209 |
| Sierra Leoneans | 98.6 /100 | #75 | Exceptional $65,038 |
| Ethiopians | 98.5 /100 | #76 | Exceptional $64,989 |
| Immigrants | Canada | 98.5 /100 | #77 | Exceptional $64,952 |
| Immigrants | Western Europe | 98.5 /100 | #78 | Exceptional $64,933 |
| Hawaiians | 98.4 /100 | #79 | Exceptional $64,920 |
| Immigrants | North America | 98.3 /100 | #80 | Exceptional $64,856 |
| Immigrants | Europe | 98.3 /100 | #81 | Exceptional $64,828 |