Immigrants from Western Africa vs Lithuanian Householder Income Over 65 years

COMPARE

Immigrants from Western Africa
Race
Ancestry
AfghanAfricanAlaska NativeAlaskan AthabascanAlbanianAleutAlsatianAmericanApacheArabArapahoArgentineanArmenianAssyrian/Chaldean/SyriacAustralianAustrianBahamianBangladeshiBarbadianBasqueBelgianBelizeanBermudanBhutaneseBlackfeetBolivianBrazilianBritishBritish West IndianBulgarianBurmeseCajunCambodianCanadianCape VerdeanCarpatho RusynCelticCentral AmericanCentral American IndianCherokeeCheyenneChickasawChileanChineseChippewaChoctawColombianColvilleComancheCosta RicanCreeCreekCroatianCrowCubanCypriotCzechCzechoslovakianDanishDelawareDominicanDutchDutch West IndianEastern EuropeanEcuadorianEgyptianEnglishEstonianEthiopianEuropeanFijianFilipinoFinnishFrenchFrench American IndianFrench CanadianGermanGerman RussianGhanaianGreekGuamanian/ChamorroGuatemalanGuyaneseHaitianHmongHonduranHopiHoumaHungarianIcelanderIndian (Asian)IndonesianInupiatIranianIraqiIrishIroquoisIsraeliItalianJamaicanJapaneseJordanianKenyanKiowaKoreanLaotianLatvianLebaneseLiberianLumbeeLuxembourgerMacedonianMalaysianMalteseMarshalleseMenomineeMexicanMexican American IndianMongolianMoroccanNative HawaiianNavajoNepaleseNew ZealanderNicaraguanNigerianNorthern EuropeanNorwegianOkinawanOsageOttawaPaiutePakistaniPalestinianPanamanianParaguayanPennsylvania GermanPeruvianPimaPolishPortuguesePotawatomiPuebloPuerto RicanPuget Sound SalishRomanianRussianSalvadoranSamoanScandinavianScotch-IrishScottishSeminoleSenegaleseSerbianShoshoneSierra LeoneanSiouxSlavicSlovakSloveneSomaliSouth AfricanSouth AmericanSouth American IndianSoviet UnionSpaniardSpanishSpanish AmericanSpanish American IndianSri LankanSubsaharan AfricanSudaneseSwedishSwissSyrianTaiwaneseThaiTlingit-HaidaTohono O'OdhamTonganTrinidadian and TobagonianTsimshianTurkishU.S. Virgin IslanderUgandanUkrainianUruguayanUteVenezuelanVietnameseWelshWest IndianYakamaYaquiYugoslavianYumanYup'ikZimbabwean
Immigration
NonimmigrantsImmigrantsAfghanistanAfricaAlbaniaArgentinaArmeniaAsiaAustraliaAustriaBahamasBangladeshBarbadosBelarusBelgiumBelizeBoliviaBosnia and HerzegovinaBrazilBulgariaBurma/MyanmarCabo VerdeCambodiaCameroonCanadaCaribbeanCentral AmericaChileChinaColombiaCongoCosta RicaCroatiaCubaCzechoslovakiaDenmarkDominicaDominican RepublicEastern AfricaEastern AsiaEastern EuropeEcuadorEgyptEl SalvadorEnglandEritreaEthiopiaEuropeFijiFranceGermanyGhanaGreeceGrenadaGuatemalaGuyanaHaitiHondurasHong KongHungaryIndiaIndonesiaIranIraqIrelandIsraelItalyJamaicaJapanJordanKazakhstanKenyaKoreaKuwaitLaosLatin AmericaLatviaLebanonLiberiaLithuaniaMalaysiaMexicoMicronesiaMiddle AfricaMoldovaMoroccoNepalNetherlandsNicaraguaNigeriaNorth AmericaNorth MacedoniaNorthern AfricaNorthern EuropeNorwayOceaniaPakistanPanamaPeruPhilippinesPolandPortugalRomaniaRussiaSaudi ArabiaScotlandSenegalSerbiaSierra LeoneSingaporeSomaliaSouth AfricaSouth AmericaSouth Central AsiaSouth Eastern AsiaSouthern EuropeSpainSri LankaSt. Vincent and the GrenadinesSudanSwedenSwitzerlandSyriaTaiwanThailandTrinidad and TobagoTurkeyUgandaUkraineUruguayUzbekistanVenezuelaVietnamWest IndiesWestern AfricaWestern AsiaWestern EuropeYemenZaireZimbabweAzores
Lithuanian
Race
Ancestry
AfghanAfricanAlaska NativeAlaskan AthabascanAlbanianAleutAlsatianAmericanApacheArabArapahoArgentineanArmenianAssyrian/Chaldean/SyriacAustralianAustrianBahamianBangladeshiBarbadianBasqueBelgianBelizeanBermudanBhutaneseBlackfeetBolivianBrazilianBritishBritish West IndianBulgarianBurmeseCajunCambodianCanadianCape VerdeanCarpatho RusynCelticCentral AmericanCentral American IndianCherokeeCheyenneChickasawChileanChineseChippewaChoctawColombianColvilleComancheCosta RicanCreeCreekCroatianCrowCubanCypriotCzechCzechoslovakianDanishDelawareDominicanDutchDutch West IndianEastern EuropeanEcuadorianEgyptianEnglishEstonianEthiopianEuropeanFijianFilipinoFinnishFrenchFrench American IndianFrench CanadianGermanGerman RussianGhanaianGreekGuamanian/ChamorroGuatemalanGuyaneseHaitianHmongHonduranHopiHoumaHungarianIcelanderIndian (Asian)IndonesianInupiatIranianIraqiIrishIroquoisIsraeliItalianJamaicanJapaneseJordanianKenyanKiowaKoreanLaotianLatvianLebaneseLiberianLithuanianLumbeeLuxembourgerMacedonianMalaysianMalteseMarshalleseMenomineeMexicanMexican American IndianMongolianMoroccanNative HawaiianNavajoNepaleseNew ZealanderNicaraguanNigerianNorthern EuropeanNorwegianOkinawanOsageOttawaPaiutePakistaniPalestinianPanamanianParaguayanPennsylvania GermanPeruvianPimaPolishPortuguesePotawatomiPuebloPuerto RicanPuget Sound SalishRomanianRussianSalvadoranSamoanScandinavianScotch-IrishScottishSeminoleSenegaleseSerbianShoshoneSierra LeoneanSiouxSlavicSlovakSloveneSomaliSouth AfricanSouth AmericanSouth American IndianSoviet UnionSpaniardSpanishSpanish AmericanSpanish American IndianSri LankanSubsaharan AfricanSudaneseSwedishSwissSyrianTaiwaneseThaiTlingit-HaidaTohono O'OdhamTonganTrinidadian and TobagonianTsimshianTurkishU.S. Virgin IslanderUgandanUkrainianUruguayanUteVenezuelanVietnameseWelshWest IndianYakamaYaquiYugoslavianYumanYup'ikZimbabwean
Immigration
NonimmigrantsImmigrantsAfghanistanAfricaAlbaniaArgentinaArmeniaAsiaAustraliaAustriaBahamasBangladeshBarbadosBelarusBelgiumBelizeBoliviaBosnia and HerzegovinaBrazilBulgariaBurma/MyanmarCabo VerdeCambodiaCameroonCanadaCaribbeanCentral AmericaChileChinaColombiaCongoCosta RicaCroatiaCubaCzechoslovakiaDenmarkDominicaDominican RepublicEastern AfricaEastern AsiaEastern EuropeEcuadorEgyptEl SalvadorEnglandEritreaEthiopiaEuropeFijiFranceGermanyGhanaGreeceGrenadaGuatemalaGuyanaHaitiHondurasHong KongHungaryIndiaIndonesiaIranIraqIrelandIsraelItalyJamaicaJapanJordanKazakhstanKenyaKoreaKuwaitLaosLatin AmericaLatviaLebanonLiberiaLithuaniaMalaysiaMexicoMicronesiaMiddle AfricaMoldovaMoroccoNepalNetherlandsNicaraguaNigeriaNorth AmericaNorth MacedoniaNorthern AfricaNorthern EuropeNorwayOceaniaPakistanPanamaPeruPhilippinesPolandPortugalRomaniaRussiaSaudi ArabiaScotlandSenegalSerbiaSierra LeoneSingaporeSomaliaSouth AfricaSouth AmericaSouth Central AsiaSouth Eastern AsiaSouthern EuropeSpainSri LankaSt. Vincent and the GrenadinesSudanSwedenSwitzerlandSyriaTaiwanThailandTrinidad and TobagoTurkeyUgandaUkraineUruguayUzbekistanVenezuelaVietnamWest IndiesWestern AsiaWestern EuropeYemenZaireZimbabweAzores
Householder Income Over 65 years
Income
Poverty
Unemployment
Labor Participation
Family Structure
Vehicle Availability
Education Level
Disability

Householder Income Over 65 years Comparison

Immigrants from Western Africa

Lithuanians

Tragic
Exceptional
$57,119
HOUSEHOLDER INCOME OVER 65 YEARS
1.7/ 100
METRIC RATING
233rd/ 347
METRIC RANK
$65,209
HOUSEHOLDER INCOME OVER 65 YEARS
98.8/ 100
METRIC RATING
74th/ 347
METRIC RANK

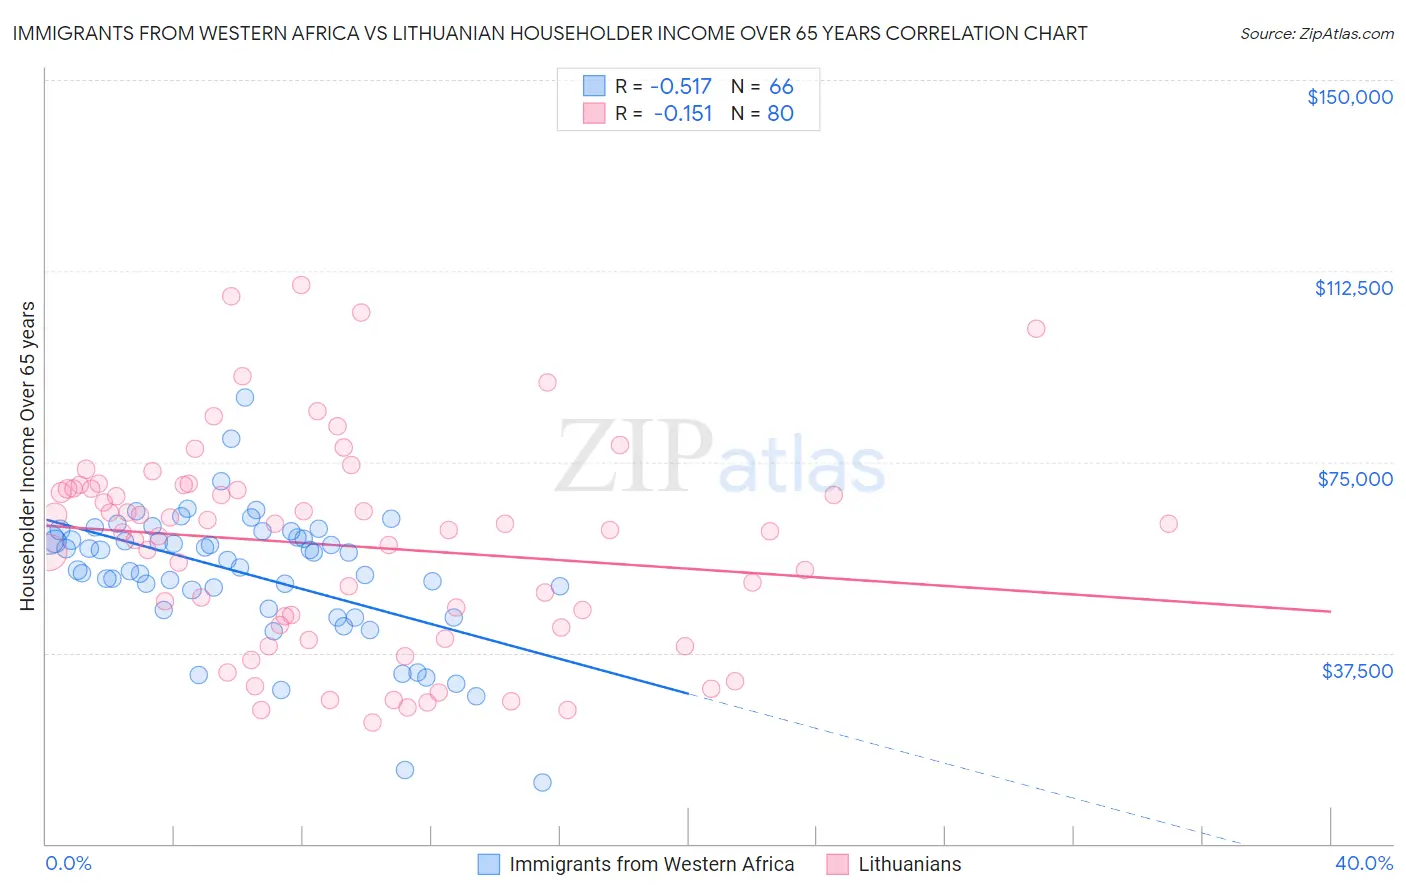
Immigrants from Western Africa vs Lithuanian Householder Income Over 65 years Correlation Chart

The statistical analysis conducted on geographies consisting of 356,345,193 people shows a substantial negative correlation between the proportion of Immigrants from Western Africa and household income with householder over the age of 65 in the United States with a correlation coefficient (R) of -0.517 and weighted average of $57,119. Similarly, the statistical analysis conducted on geographies consisting of 420,649,673 people shows a poor negative correlation between the proportion of Lithuanians and household income with householder over the age of 65 in the United States with a correlation coefficient (R) of -0.151 and weighted average of $65,209, a difference of 14.2%.
Immigrants from Western Africa vs Lithuanian Householder Income Over 65 years

Householder Income Over 65 years Correlation Summary

MeasurementImmigrants from Western AfricaLithuanian
Minimum$12,021$23,920
Maximum$87,727$109,815
Range$75,706$85,895
Mean$52,989$58,554
Median$56,535$61,584
Interquartile 25% (IQ1)$46,214$42,717
Interquartile 75% (IQ3)$60,055$69,714
Interquartile Range (IQR)$13,840$26,997
Standard Deviation (Sample)$13,149$20,286
Standard Deviation (Population)$13,049$20,159

Similar Demographics by Householder Income Over 65 years

Demographics Similar to Immigrants from Western Africa by Householder Income Over 65 years

In terms of householder income over 65 years, the demographic groups most similar to Immigrants from Western Africa are Immigrants from Burma/Myanmar ($57,114, a difference of 0.010%), Spanish American ($57,021, a difference of 0.17%), Immigrants from Uruguay ($56,975, a difference of 0.25%), Immigrants from Panama ($56,944, a difference of 0.31%), and Immigrants from Venezuela ($57,371, a difference of 0.44%).
DemographicsRating | RankHouseholder Income Over 65 years
French Canadians
4.2
/100
|
#226
Tragic
$57,975
Japanese
3.9
/100
|
#227
Tragic
$57,919
Immigrants | Albania
3.6
/100
|
#228
Tragic
$57,828
Immigrants | Colombia
3.0
/100
|
#229
Tragic
$57,658
Immigrants | Cambodia
2.8
/100
|
#230
Tragic
$57,580
Immigrants | Nonimmigrants
2.4
/100
|
#231
Tragic
$57,426
Immigrants | Venezuela
2.3
/100
|
#232
Tragic
$57,371
Immigrants | Western Africa
1.7
/100
|
#233
Tragic
$57,119
Immigrants | Burma/Myanmar
1.7
/100
|
#234
Tragic
$57,114
Spanish Americans
1.6
/100
|
#235
Tragic
$57,021
Immigrants | Uruguay
1.5
/100
|
#236
Tragic
$56,975
Immigrants | Panama
1.5
/100
|
#237
Tragic
$56,944
Fijians
1.2
/100
|
#238
Tragic
$56,768
Immigrants | Laos
1.2
/100
|
#239
Tragic
$56,722
Sub-Saharan Africans
1.0
/100
|
#240
Tragic
$56,615

Demographics Similar to Lithuanians by Householder Income Over 65 years

In terms of householder income over 65 years, the demographic groups most similar to Lithuanians are Immigrants from Ethiopia ($65,238, a difference of 0.040%), Argentinean ($65,246, a difference of 0.060%), Greek ($65,306, a difference of 0.15%), Mongolian ($65,326, a difference of 0.18%), and Sierra Leonean ($65,038, a difference of 0.26%).
DemographicsRating | RankHouseholder Income Over 65 years
Immigrants | Malaysia
99.1
/100
|
#67
Exceptional
$65,497
Egyptians
99.1
/100
|
#68
Exceptional
$65,441
Samoans
99.1
/100
|
#69
Exceptional
$65,427
Mongolians
99.0
/100
|
#70
Exceptional
$65,326
Greeks
98.9
/100
|
#71
Exceptional
$65,306
Argentineans
98.9
/100
|
#72
Exceptional
$65,246
Immigrants | Ethiopia
98.9
/100
|
#73
Exceptional
$65,238
Lithuanians
98.8
/100
|
#74
Exceptional
$65,209
Sierra Leoneans
98.6
/100
|
#75
Exceptional
$65,038
Ethiopians
98.5
/100
|
#76
Exceptional
$64,989
Immigrants | Canada
98.5
/100
|
#77
Exceptional
$64,952
Immigrants | Western Europe
98.5
/100
|
#78
Exceptional
$64,933
Hawaiians
98.4
/100
|
#79
Exceptional
$64,920
Immigrants | North America
98.3
/100
|
#80
Exceptional
$64,856
Immigrants | Europe
98.3
/100
|
#81
Exceptional
$64,828