Native/Alaskan vs Lithuanian Disability Age 18 to 34
COMPARE
Native/Alaskan
Lithuanian
Disability Age 18 to 34
Disability Age 18 to 34 Comparison
Natives/Alaskans
Lithuanians
8.2%
DISABILITY AGE 18 TO 34
0.0/ 100
METRIC RATING
325th/ 347
METRIC RANK
7.0%
DISABILITY AGE 18 TO 34
4.1/ 100
METRIC RATING
229th/ 347
METRIC RANK
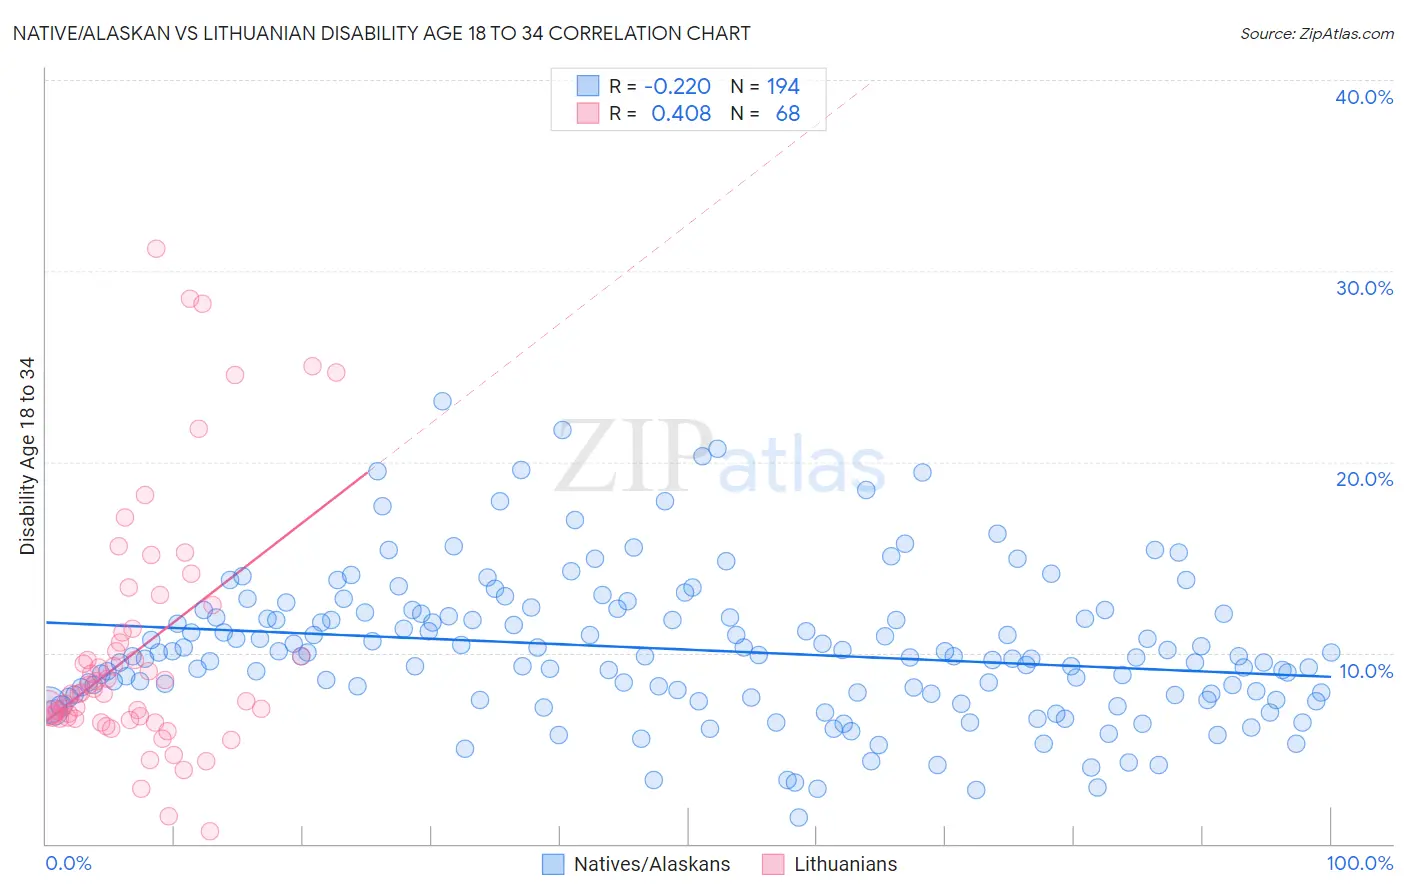
Native/Alaskan vs Lithuanian Disability Age 18 to 34 Correlation Chart
The statistical analysis conducted on geographies consisting of 510,415,530 people shows a weak negative correlation between the proportion of Natives/Alaskans and percentage of population with a disability between the ages 18 and 35 in the United States with a correlation coefficient (R) of -0.220 and weighted average of 8.2%. Similarly, the statistical analysis conducted on geographies consisting of 420,363,620 people shows a moderate positive correlation between the proportion of Lithuanians and percentage of population with a disability between the ages 18 and 35 in the United States with a correlation coefficient (R) of 0.408 and weighted average of 7.0%, a difference of 18.0%.
Disability Age 18 to 34 Correlation Summary
| Measurement | Native/Alaskan | Lithuanian |
| Minimum | 1.4% | 0.63% |
| Maximum | 23.1% | 31.1% |
| Range | 21.8% | 30.5% |
| Mean | 10.2% | 10.2% |
| Median | 9.8% | 7.9% |
| Interquartile 25% (IQ1) | 7.8% | 6.6% |
| Interquartile 75% (IQ3) | 12.1% | 11.2% |
| Interquartile Range (IQR) | 4.2% | 4.6% |
| Standard Deviation (Sample) | 3.8% | 6.5% |
| Standard Deviation (Population) | 3.8% | 6.4% |
Similar Demographics by Disability Age 18 to 34
Demographics Similar to Natives/Alaskans by Disability Age 18 to 34
In terms of disability age 18 to 34, the demographic groups most similar to Natives/Alaskans are Potawatomi (8.2%, a difference of 0.020%), Sioux (8.2%, a difference of 0.14%), Delaware (8.2%, a difference of 0.19%), Cajun (8.2%, a difference of 0.52%), and French American Indian (8.2%, a difference of 0.56%).
| Demographics | Rating | Rank | Disability Age 18 to 34 |
| French Canadians | 0.0 /100 | #318 | Tragic 8.1% |
| Aleuts | 0.0 /100 | #319 | Tragic 8.1% |
| Navajo | 0.0 /100 | #320 | Tragic 8.1% |
| Blackfeet | 0.0 /100 | #321 | Tragic 8.1% |
| Cree | 0.0 /100 | #322 | Tragic 8.1% |
| French American Indians | 0.0 /100 | #323 | Tragic 8.2% |
| Cajuns | 0.0 /100 | #324 | Tragic 8.2% |
| Natives/Alaskans | 0.0 /100 | #325 | Tragic 8.2% |
| Potawatomi | 0.0 /100 | #326 | Tragic 8.2% |
| Sioux | 0.0 /100 | #327 | Tragic 8.2% |
| Delaware | 0.0 /100 | #328 | Tragic 8.2% |
| Crow | 0.0 /100 | #329 | Tragic 8.3% |
| Osage | 0.0 /100 | #330 | Tragic 8.3% |
| Comanche | 0.0 /100 | #331 | Tragic 8.3% |
| Puget Sound Salish | 0.0 /100 | #332 | Tragic 8.3% |
Demographics Similar to Lithuanians by Disability Age 18 to 34
In terms of disability age 18 to 34, the demographic groups most similar to Lithuanians are Immigrants from Yemen (7.0%, a difference of 0.030%), Immigrants from Canada (7.0%, a difference of 0.080%), Immigrants from North America (7.0%, a difference of 0.090%), Ute (7.0%, a difference of 0.11%), and Ugandan (6.9%, a difference of 0.13%).
| Demographics | Rating | Rank | Disability Age 18 to 34 |
| Immigrants | England | 5.3 /100 | #222 | Tragic 6.9% |
| Carpatho Rusyns | 5.2 /100 | #223 | Tragic 6.9% |
| Senegalese | 4.9 /100 | #224 | Tragic 6.9% |
| Central American Indians | 4.7 /100 | #225 | Tragic 6.9% |
| Ugandans | 4.4 /100 | #226 | Tragic 6.9% |
| Immigrants | Canada | 4.3 /100 | #227 | Tragic 7.0% |
| Immigrants | Yemen | 4.2 /100 | #228 | Tragic 7.0% |
| Lithuanians | 4.1 /100 | #229 | Tragic 7.0% |
| Immigrants | North America | 3.9 /100 | #230 | Tragic 7.0% |
| Ute | 3.8 /100 | #231 | Tragic 7.0% |
| Samoans | 3.2 /100 | #232 | Tragic 7.0% |
| New Zealanders | 2.7 /100 | #233 | Tragic 7.0% |
| Alsatians | 2.1 /100 | #234 | Tragic 7.0% |
| Sub-Saharan Africans | 1.7 /100 | #235 | Tragic 7.1% |
| Liberians | 1.5 /100 | #236 | Tragic 7.1% |