Native/Alaskan vs Lithuanian Family Households with Children

COMPARE

Native/Alaskan
Race
Ancestry
AfghanAfricanAlaska NativeAlaskan AthabascanAlbanianAleutAlsatianAmericanApacheArabArapahoArgentineanArmenianAssyrian/Chaldean/SyriacAustralianAustrianBahamianBangladeshiBarbadianBasqueBelgianBelizeanBermudanBhutaneseBlackfeetBolivianBrazilianBritishBritish West IndianBulgarianBurmeseCajunCambodianCanadianCape VerdeanCarpatho RusynCelticCentral AmericanCentral American IndianCherokeeCheyenneChickasawChileanChineseChippewaChoctawColombianColvilleComancheCosta RicanCreeCreekCroatianCrowCubanCypriotCzechCzechoslovakianDanishDelawareDominicanDutchDutch West IndianEastern EuropeanEcuadorianEgyptianEnglishEstonianEthiopianEuropeanFijianFilipinoFinnishFrenchFrench American IndianFrench CanadianGermanGerman RussianGhanaianGreekGuamanian/ChamorroGuatemalanGuyaneseHaitianHmongHonduranHopiHoumaHungarianIcelanderIndian (Asian)IndonesianInupiatIranianIraqiIrishIroquoisIsraeliItalianJamaicanJapaneseJordanianKenyanKiowaKoreanLaotianLatvianLebaneseLiberianLumbeeLuxembourgerMacedonianMalaysianMalteseMarshalleseMenomineeMexicanMexican American IndianMongolianMoroccanNative HawaiianNavajoNepaleseNew ZealanderNicaraguanNigerianNorthern EuropeanNorwegianOkinawanOsageOttawaPaiutePakistaniPalestinianPanamanianParaguayanPennsylvania GermanPeruvianPimaPolishPortuguesePotawatomiPuebloPuerto RicanPuget Sound SalishRomanianRussianSalvadoranSamoanScandinavianScotch-IrishScottishSeminoleSenegaleseSerbianShoshoneSierra LeoneanSiouxSlavicSlovakSloveneSomaliSouth AfricanSouth AmericanSouth American IndianSoviet UnionSpaniardSpanishSpanish AmericanSpanish American IndianSri LankanSubsaharan AfricanSudaneseSwedishSwissSyrianTaiwaneseThaiTlingit-HaidaTohono O'OdhamTonganTrinidadian and TobagonianTsimshianTurkishU.S. Virgin IslanderUgandanUkrainianUruguayanUteVenezuelanVietnameseWelshWest IndianYakamaYaquiYugoslavianYumanYup'ikZimbabwean
Immigration
NonimmigrantsImmigrantsAfghanistanAfricaAlbaniaArgentinaArmeniaAsiaAustraliaAustriaBahamasBangladeshBarbadosBelarusBelgiumBelizeBoliviaBosnia and HerzegovinaBrazilBulgariaBurma/MyanmarCabo VerdeCambodiaCameroonCanadaCaribbeanCentral AmericaChileChinaColombiaCongoCosta RicaCroatiaCubaCzechoslovakiaDenmarkDominicaDominican RepublicEastern AfricaEastern AsiaEastern EuropeEcuadorEgyptEl SalvadorEnglandEritreaEthiopiaEuropeFijiFranceGermanyGhanaGreeceGrenadaGuatemalaGuyanaHaitiHondurasHong KongHungaryIndiaIndonesiaIranIraqIrelandIsraelItalyJamaicaJapanJordanKazakhstanKenyaKoreaKuwaitLaosLatin AmericaLatviaLebanonLiberiaLithuaniaMalaysiaMexicoMicronesiaMiddle AfricaMoldovaMoroccoNepalNetherlandsNicaraguaNigeriaNorth AmericaNorth MacedoniaNorthern AfricaNorthern EuropeNorwayOceaniaPakistanPanamaPeruPhilippinesPolandPortugalRomaniaRussiaSaudi ArabiaScotlandSenegalSerbiaSierra LeoneSingaporeSomaliaSouth AfricaSouth AmericaSouth Central AsiaSouth Eastern AsiaSouthern EuropeSpainSri LankaSt. Vincent and the GrenadinesSudanSwedenSwitzerlandSyriaTaiwanThailandTrinidad and TobagoTurkeyUgandaUkraineUruguayUzbekistanVenezuelaVietnamWest IndiesWestern AfricaWestern AsiaWestern EuropeYemenZaireZimbabweAzores
Lithuanian
Race
Ancestry
AfghanAfricanAlaska NativeAlaskan AthabascanAlbanianAleutAlsatianAmericanApacheArabArapahoArgentineanArmenianAssyrian/Chaldean/SyriacAustralianAustrianBahamianBangladeshiBarbadianBasqueBelgianBelizeanBermudanBhutaneseBlackfeetBolivianBrazilianBritishBritish West IndianBulgarianBurmeseCajunCambodianCanadianCape VerdeanCarpatho RusynCelticCentral AmericanCentral American IndianCherokeeCheyenneChickasawChileanChineseChippewaChoctawColombianColvilleComancheCosta RicanCreeCreekCroatianCrowCubanCypriotCzechCzechoslovakianDanishDelawareDominicanDutchDutch West IndianEastern EuropeanEcuadorianEgyptianEnglishEstonianEthiopianEuropeanFijianFilipinoFinnishFrenchFrench American IndianFrench CanadianGermanGerman RussianGhanaianGreekGuamanian/ChamorroGuatemalanGuyaneseHaitianHmongHonduranHopiHoumaHungarianIcelanderIndian (Asian)IndonesianInupiatIranianIraqiIrishIroquoisIsraeliItalianJamaicanJapaneseJordanianKenyanKiowaKoreanLaotianLatvianLebaneseLiberianLithuanianLumbeeLuxembourgerMacedonianMalaysianMalteseMarshalleseMenomineeMexicanMexican American IndianMongolianMoroccanNative HawaiianNavajoNepaleseNew ZealanderNicaraguanNigerianNorthern EuropeanNorwegianOkinawanOsageOttawaPaiutePakistaniPalestinianPanamanianParaguayanPennsylvania GermanPeruvianPimaPolishPortuguesePotawatomiPuebloPuerto RicanPuget Sound SalishRomanianRussianSalvadoranSamoanScandinavianScotch-IrishScottishSeminoleSenegaleseSerbianShoshoneSierra LeoneanSiouxSlavicSlovakSloveneSomaliSouth AfricanSouth AmericanSouth American IndianSoviet UnionSpaniardSpanishSpanish AmericanSpanish American IndianSri LankanSubsaharan AfricanSudaneseSwedishSwissSyrianTaiwaneseThaiTlingit-HaidaTohono O'OdhamTonganTrinidadian and TobagonianTsimshianTurkishU.S. Virgin IslanderUgandanUkrainianUruguayanUteVenezuelanVietnameseWelshWest IndianYakamaYaquiYugoslavianYumanYup'ikZimbabwean
Immigration
NonimmigrantsImmigrantsAfghanistanAfricaAlbaniaArgentinaArmeniaAsiaAustraliaAustriaBahamasBangladeshBarbadosBelarusBelgiumBelizeBoliviaBosnia and HerzegovinaBrazilBulgariaBurma/MyanmarCabo VerdeCambodiaCameroonCanadaCaribbeanCentral AmericaChileChinaColombiaCongoCosta RicaCroatiaCubaCzechoslovakiaDenmarkDominicaDominican RepublicEastern AfricaEastern AsiaEastern EuropeEcuadorEgyptEl SalvadorEnglandEritreaEthiopiaEuropeFijiFranceGermanyGhanaGreeceGrenadaGuatemalaGuyanaHaitiHondurasHong KongHungaryIndiaIndonesiaIranIraqIrelandIsraelItalyJamaicaJapanJordanKazakhstanKenyaKoreaKuwaitLaosLatin AmericaLatviaLebanonLiberiaLithuaniaMalaysiaMexicoMicronesiaMiddle AfricaMoldovaMoroccoNepalNetherlandsNicaraguaNigeriaNorth AmericaNorth MacedoniaNorthern AfricaNorthern EuropeNorwayOceaniaPakistanPanamaPeruPhilippinesPolandPortugalRomaniaRussiaSaudi ArabiaScotlandSenegalSerbiaSierra LeoneSingaporeSomaliaSouth AfricaSouth AmericaSouth Central AsiaSouth Eastern AsiaSouthern EuropeSpainSri LankaSt. Vincent and the GrenadinesSudanSwedenSwitzerlandSyriaTaiwanThailandTrinidad and TobagoTurkeyUgandaUkraineUruguayUzbekistanVenezuelaVietnamWest IndiesWestern AfricaWestern AsiaWestern EuropeYemenZaireZimbabweAzores
Family Households with Children
Income
Poverty
Unemployment
Labor Participation
Family Structure
Vehicle Availability
Education Level
Disability

Family Households with Children Comparison

Natives/Alaskans

Lithuanians

Exceptional
Tragic
28.4%
FAMILY HOUSEHOLDS WITH CHILDREN
99.8/ 100
METRIC RATING
80th/ 347
METRIC RANK
26.6%
FAMILY HOUSEHOLDS WITH CHILDREN
0.3/ 100
METRIC RATING
281st/ 347
METRIC RANK

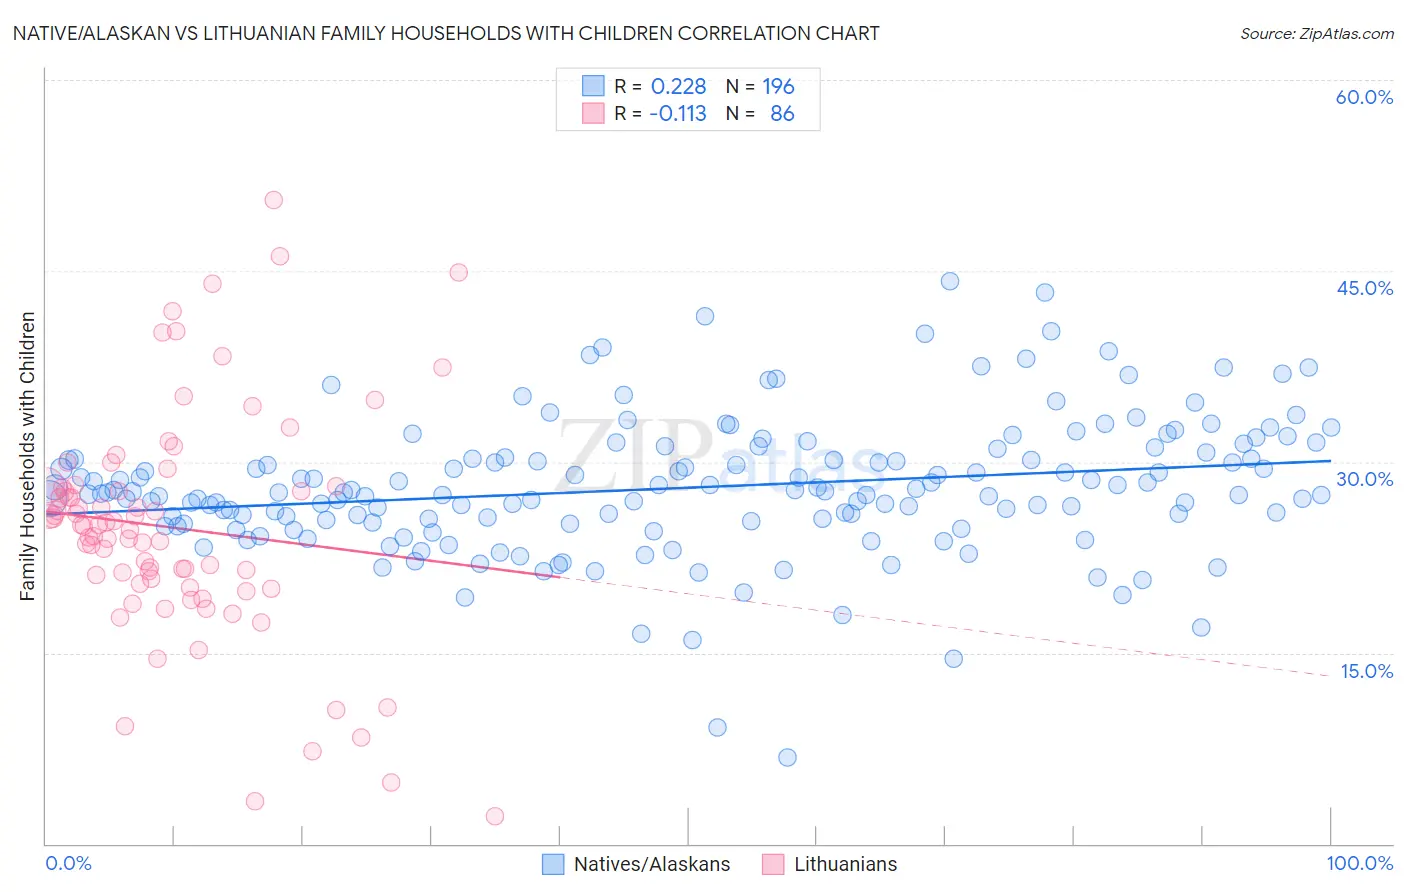
Native/Alaskan vs Lithuanian Family Households with Children Correlation Chart

The statistical analysis conducted on geographies consisting of 512,450,459 people shows a weak positive correlation between the proportion of Natives/Alaskans and percentage of family households with children in the United States with a correlation coefficient (R) of 0.228 and weighted average of 28.4%. Similarly, the statistical analysis conducted on geographies consisting of 421,521,006 people shows a poor negative correlation between the proportion of Lithuanians and percentage of family households with children in the United States with a correlation coefficient (R) of -0.113 and weighted average of 26.6%, a difference of 6.9%.
Native/Alaskan vs Lithuanian Family Households with Children

Family Households with Children Correlation Summary

MeasurementNative/AlaskanLithuanian
Minimum6.8%2.2%
Maximum44.2%50.6%
Range37.4%48.4%
Mean28.0%24.8%
Median27.6%25.0%
Interquartile 25% (IQ1)25.2%20.4%
Interquartile 75% (IQ3)30.3%28.1%
Interquartile Range (IQR)5.1%7.7%
Standard Deviation (Sample)5.4%9.1%
Standard Deviation (Population)5.4%9.0%

Similar Demographics by Family Households with Children

Demographics Similar to Natives/Alaskans by Family Households with Children

In terms of family households with children, the demographic groups most similar to Natives/Alaskans are Immigrants from Iraq (28.4%, a difference of 0.010%), South American (28.4%, a difference of 0.020%), Immigrants from Nepal (28.4%, a difference of 0.040%), Kenyan (28.4%, a difference of 0.070%), and Nigerian (28.4%, a difference of 0.080%).
DemographicsRating | RankFamily Households with Children
Iraqis
99.9
/100
|
#73
Exceptional
28.5%
Laotians
99.9
/100
|
#74
Exceptional
28.5%
Immigrants | Jordan
99.9
/100
|
#75
Exceptional
28.4%
Immigrants | Sri Lanka
99.9
/100
|
#76
Exceptional
28.4%
Nigerians
99.8
/100
|
#77
Exceptional
28.4%
Immigrants | Nepal
99.8
/100
|
#78
Exceptional
28.4%
Immigrants | Iraq
99.8
/100
|
#79
Exceptional
28.4%
Natives/Alaskans
99.8
/100
|
#80
Exceptional
28.4%
South Americans
99.8
/100
|
#81
Exceptional
28.4%
Kenyans
99.8
/100
|
#82
Exceptional
28.4%
Nicaraguans
99.8
/100
|
#83
Exceptional
28.4%
Costa Ricans
99.8
/100
|
#84
Exceptional
28.4%
Immigrants | Syria
99.8
/100
|
#85
Exceptional
28.4%
Immigrants | Western Africa
99.6
/100
|
#86
Exceptional
28.3%
Colombians
99.6
/100
|
#87
Exceptional
28.3%

Demographics Similar to Lithuanians by Family Households with Children

In terms of family households with children, the demographic groups most similar to Lithuanians are French American Indian (26.6%, a difference of 0.010%), Immigrants from North America (26.6%, a difference of 0.080%), Senegalese (26.6%, a difference of 0.090%), Immigrants from Canada (26.5%, a difference of 0.10%), and Finnish (26.6%, a difference of 0.12%).
DemographicsRating | RankFamily Households with Children
Eastern Europeans
0.6
/100
|
#274
Tragic
26.7%
Immigrants | Northern Europe
0.5
/100
|
#275
Tragic
26.7%
Immigrants | Spain
0.5
/100
|
#276
Tragic
26.6%
Celtics
0.4
/100
|
#277
Tragic
26.6%
Immigrants | Europe
0.4
/100
|
#278
Tragic
26.6%
Finns
0.4
/100
|
#279
Tragic
26.6%
Senegalese
0.4
/100
|
#280
Tragic
26.6%
Lithuanians
0.3
/100
|
#281
Tragic
26.6%
French American Indians
0.3
/100
|
#282
Tragic
26.6%
Immigrants | North America
0.3
/100
|
#283
Tragic
26.6%
Immigrants | Canada
0.3
/100
|
#284
Tragic
26.5%
Cambodians
0.2
/100
|
#285
Tragic
26.5%
Immigrants | Senegal
0.2
/100
|
#286
Tragic
26.5%
Shoshone
0.2
/100
|
#287
Tragic
26.5%
Russians
0.2
/100
|
#288
Tragic
26.5%