Native/Alaskan vs Immigrants from Hong Kong Median Male Earnings
COMPARE
Native/Alaskan
Immigrants from Hong Kong
Median Male Earnings
Median Male Earnings Comparison
Natives/Alaskans
Immigrants from Hong Kong
$44,775
MEDIAN MALE EARNINGS
0.0/ 100
METRIC RATING
331st/ 347
METRIC RANK
$70,146
MEDIAN MALE EARNINGS
100.0/ 100
METRIC RATING
7th/ 347
METRIC RANK
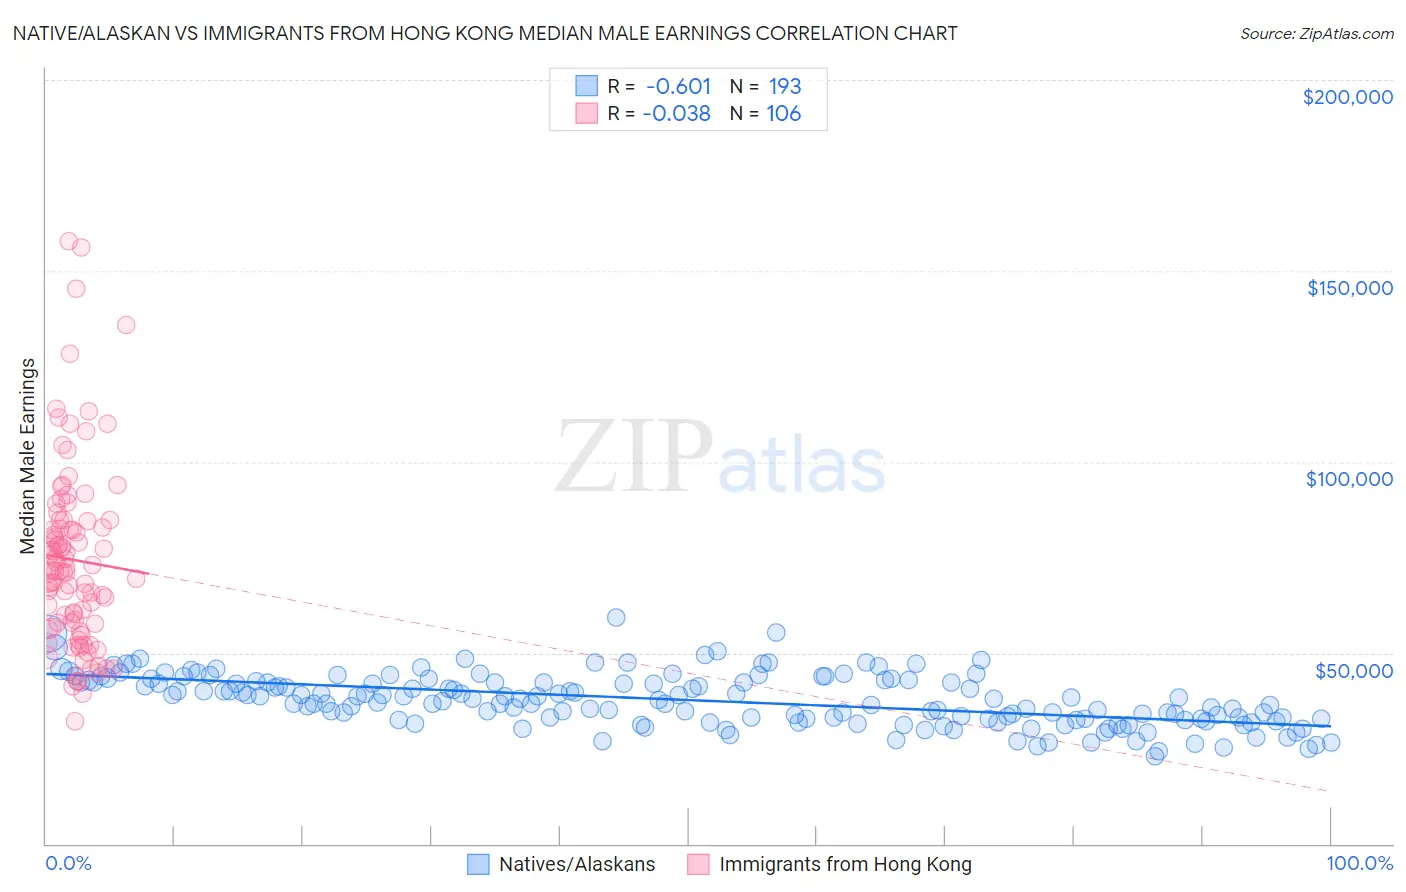
Native/Alaskan vs Immigrants from Hong Kong Median Male Earnings Correlation Chart
The statistical analysis conducted on geographies consisting of 512,408,867 people shows a significant negative correlation between the proportion of Natives/Alaskans and median male earnings in the United States with a correlation coefficient (R) of -0.601 and weighted average of $44,775. Similarly, the statistical analysis conducted on geographies consisting of 253,977,205 people shows no correlation between the proportion of Immigrants from Hong Kong and median male earnings in the United States with a correlation coefficient (R) of -0.038 and weighted average of $70,146, a difference of 56.7%.
Median Male Earnings Correlation Summary
| Measurement | Native/Alaskan | Immigrants from Hong Kong |
| Minimum | $23,050 | $31,993 |
| Maximum | $59,216 | $157,888 |
| Range | $36,166 | $125,895 |
| Mean | $37,642 | $74,359 |
| Median | $37,848 | $71,506 |
| Interquartile 25% (IQ1) | $32,642 | $57,587 |
| Interquartile 75% (IQ3) | $42,387 | $84,451 |
| Interquartile Range (IQR) | $9,745 | $26,864 |
| Standard Deviation (Sample) | $6,692 | $24,045 |
| Standard Deviation (Population) | $6,675 | $23,931 |
Similar Demographics by Median Male Earnings
Demographics Similar to Natives/Alaskans by Median Male Earnings
In terms of median male earnings, the demographic groups most similar to Natives/Alaskans are Bahamian ($44,756, a difference of 0.040%), Immigrants from Mexico ($44,960, a difference of 0.41%), Yakama ($45,002, a difference of 0.51%), Kiowa ($45,094, a difference of 0.71%), and Immigrants from Bahamas ($45,176, a difference of 0.90%).
| Demographics | Rating | Rank | Median Male Earnings |
| Blacks/African Americans | 0.0 /100 | #324 | Tragic $45,523 |
| Yuman | 0.0 /100 | #325 | Tragic $45,446 |
| Immigrants | Haiti | 0.0 /100 | #326 | Tragic $45,266 |
| Immigrants | Bahamas | 0.0 /100 | #327 | Tragic $45,176 |
| Kiowa | 0.0 /100 | #328 | Tragic $45,094 |
| Yakama | 0.0 /100 | #329 | Tragic $45,002 |
| Immigrants | Mexico | 0.0 /100 | #330 | Tragic $44,960 |
| Natives/Alaskans | 0.0 /100 | #331 | Tragic $44,775 |
| Bahamians | 0.0 /100 | #332 | Tragic $44,756 |
| Immigrants | Congo | 0.0 /100 | #333 | Tragic $44,204 |
| Immigrants | Yemen | 0.0 /100 | #334 | Tragic $44,083 |
| Spanish American Indians | 0.0 /100 | #335 | Tragic $44,010 |
| Immigrants | Cuba | 0.0 /100 | #336 | Tragic $43,461 |
| Menominee | 0.0 /100 | #337 | Tragic $42,581 |
| Crow | 0.0 /100 | #338 | Tragic $42,434 |
Demographics Similar to Immigrants from Hong Kong by Median Male Earnings
In terms of median male earnings, the demographic groups most similar to Immigrants from Hong Kong are Iranian ($70,648, a difference of 0.72%), Immigrants from Iran ($69,284, a difference of 1.2%), Immigrants from Singapore ($71,348, a difference of 1.7%), Immigrants from South Central Asia ($68,960, a difference of 1.7%), and Immigrants from Israel ($68,716, a difference of 2.1%).
| Demographics | Rating | Rank | Median Male Earnings |
| Filipinos | 100.0 /100 | #1 | Exceptional $74,224 |
| Immigrants | India | 100.0 /100 | #2 | Exceptional $74,207 |
| Immigrants | Taiwan | 100.0 /100 | #3 | Exceptional $74,031 |
| Thais | 100.0 /100 | #4 | Exceptional $72,135 |
| Immigrants | Singapore | 100.0 /100 | #5 | Exceptional $71,348 |
| Iranians | 100.0 /100 | #6 | Exceptional $70,648 |
| Immigrants | Hong Kong | 100.0 /100 | #7 | Exceptional $70,146 |
| Immigrants | Iran | 100.0 /100 | #8 | Exceptional $69,284 |
| Immigrants | South Central Asia | 100.0 /100 | #9 | Exceptional $68,960 |
| Immigrants | Israel | 100.0 /100 | #10 | Exceptional $68,716 |
| Immigrants | Ireland | 100.0 /100 | #11 | Exceptional $67,698 |
| Immigrants | Australia | 100.0 /100 | #12 | Exceptional $67,634 |
| Immigrants | China | 100.0 /100 | #13 | Exceptional $67,353 |
| Okinawans | 100.0 /100 | #14 | Exceptional $67,232 |
| Immigrants | Eastern Asia | 100.0 /100 | #15 | Exceptional $66,903 |