Immigrants from Morocco vs Immigrants from Hong Kong Median Male Earnings
COMPARE
Immigrants from Morocco
Immigrants from Hong Kong
Median Male Earnings
Median Male Earnings Comparison
Immigrants from Morocco
Immigrants from Hong Kong
$56,958
MEDIAN MALE EARNINGS
91.8/ 100
METRIC RATING
125th/ 347
METRIC RANK
$70,146
MEDIAN MALE EARNINGS
100.0/ 100
METRIC RATING
7th/ 347
METRIC RANK
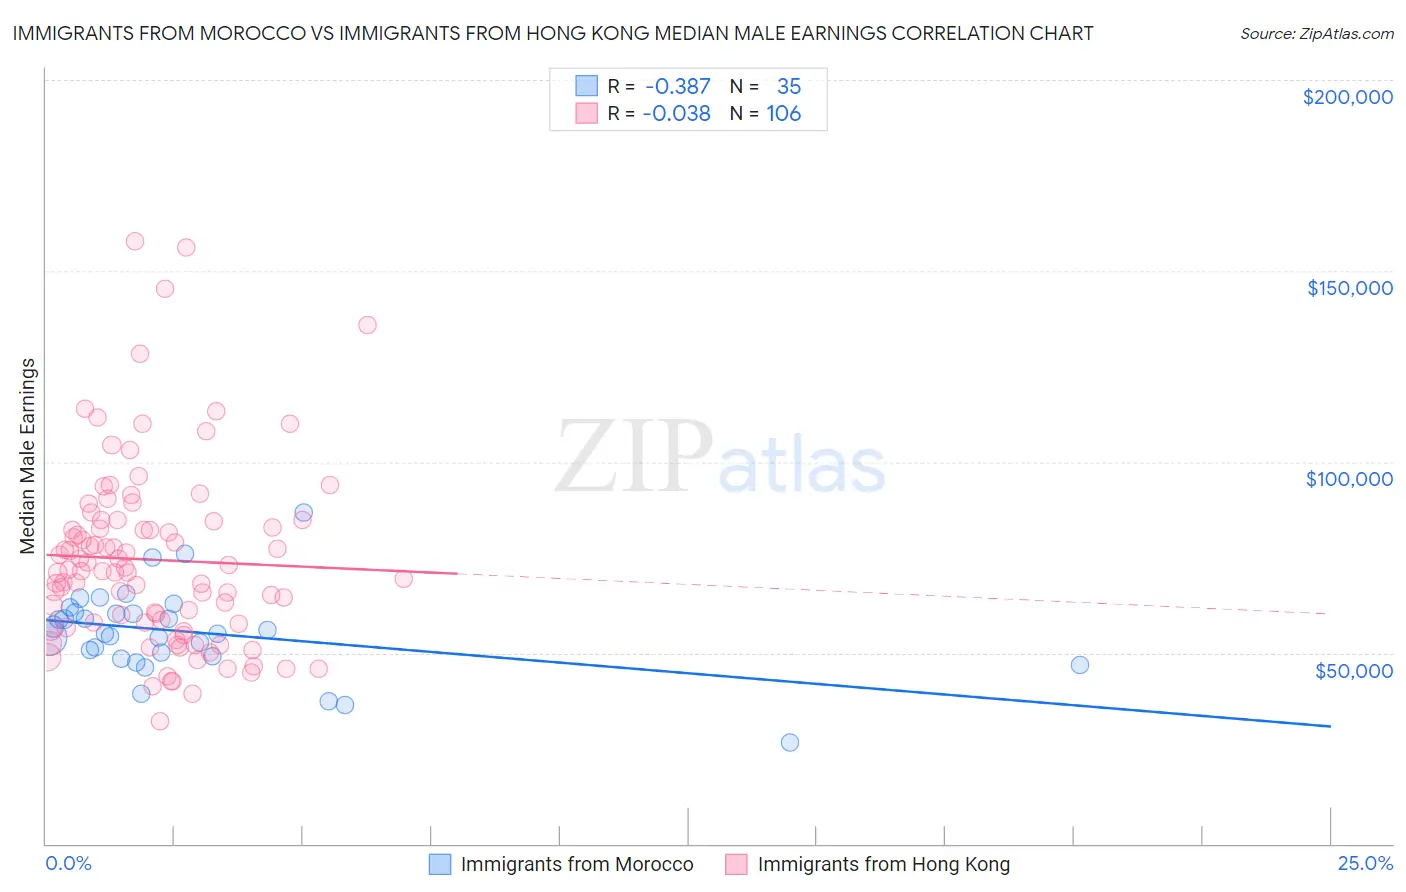
Immigrants from Morocco vs Immigrants from Hong Kong Median Male Earnings Correlation Chart
The statistical analysis conducted on geographies consisting of 178,898,918 people shows a mild negative correlation between the proportion of Immigrants from Morocco and median male earnings in the United States with a correlation coefficient (R) of -0.387 and weighted average of $56,958. Similarly, the statistical analysis conducted on geographies consisting of 253,977,205 people shows no correlation between the proportion of Immigrants from Hong Kong and median male earnings in the United States with a correlation coefficient (R) of -0.038 and weighted average of $70,146, a difference of 23.2%.
Median Male Earnings Correlation Summary
| Measurement | Immigrants from Morocco | Immigrants from Hong Kong |
| Minimum | $26,429 | $31,993 |
| Maximum | $86,602 | $157,888 |
| Range | $60,173 | $125,895 |
| Mean | $55,429 | $74,359 |
| Median | $55,129 | $71,506 |
| Interquartile 25% (IQ1) | $49,000 | $57,587 |
| Interquartile 75% (IQ3) | $60,575 | $84,451 |
| Interquartile Range (IQR) | $11,575 | $26,864 |
| Standard Deviation (Sample) | $11,412 | $24,045 |
| Standard Deviation (Population) | $11,248 | $23,931 |
Similar Demographics by Median Male Earnings
Demographics Similar to Immigrants from Morocco by Median Male Earnings
In terms of median male earnings, the demographic groups most similar to Immigrants from Morocco are Chilean ($56,973, a difference of 0.030%), Chinese ($56,872, a difference of 0.15%), Brazilian ($56,837, a difference of 0.21%), Immigrants from Syria ($56,830, a difference of 0.23%), and Immigrants from Jordan ($57,145, a difference of 0.33%).
| Demographics | Rating | Rank | Median Male Earnings |
| Hungarians | 94.0 /100 | #118 | Exceptional $57,309 |
| Arabs | 94.0 /100 | #119 | Exceptional $57,298 |
| Canadians | 93.9 /100 | #120 | Exceptional $57,286 |
| Immigrants | Albania | 93.3 /100 | #121 | Exceptional $57,179 |
| Immigrants | Jordan | 93.1 /100 | #122 | Exceptional $57,145 |
| Slovenes | 93.1 /100 | #123 | Exceptional $57,145 |
| Chileans | 91.9 /100 | #124 | Exceptional $56,973 |
| Immigrants | Morocco | 91.8 /100 | #125 | Exceptional $56,958 |
| Chinese | 91.1 /100 | #126 | Exceptional $56,872 |
| Brazilians | 90.9 /100 | #127 | Exceptional $56,837 |
| Immigrants | Syria | 90.8 /100 | #128 | Exceptional $56,830 |
| Pakistanis | 89.9 /100 | #129 | Excellent $56,719 |
| Koreans | 89.4 /100 | #130 | Excellent $56,672 |
| Portuguese | 89.4 /100 | #131 | Excellent $56,663 |
| Czechs | 88.2 /100 | #132 | Excellent $56,546 |
Demographics Similar to Immigrants from Hong Kong by Median Male Earnings
In terms of median male earnings, the demographic groups most similar to Immigrants from Hong Kong are Iranian ($70,648, a difference of 0.72%), Immigrants from Iran ($69,284, a difference of 1.2%), Immigrants from Singapore ($71,348, a difference of 1.7%), Immigrants from South Central Asia ($68,960, a difference of 1.7%), and Immigrants from Israel ($68,716, a difference of 2.1%).
| Demographics | Rating | Rank | Median Male Earnings |
| Filipinos | 100.0 /100 | #1 | Exceptional $74,224 |
| Immigrants | India | 100.0 /100 | #2 | Exceptional $74,207 |
| Immigrants | Taiwan | 100.0 /100 | #3 | Exceptional $74,031 |
| Thais | 100.0 /100 | #4 | Exceptional $72,135 |
| Immigrants | Singapore | 100.0 /100 | #5 | Exceptional $71,348 |
| Iranians | 100.0 /100 | #6 | Exceptional $70,648 |
| Immigrants | Hong Kong | 100.0 /100 | #7 | Exceptional $70,146 |
| Immigrants | Iran | 100.0 /100 | #8 | Exceptional $69,284 |
| Immigrants | South Central Asia | 100.0 /100 | #9 | Exceptional $68,960 |
| Immigrants | Israel | 100.0 /100 | #10 | Exceptional $68,716 |
| Immigrants | Ireland | 100.0 /100 | #11 | Exceptional $67,698 |
| Immigrants | Australia | 100.0 /100 | #12 | Exceptional $67,634 |
| Immigrants | China | 100.0 /100 | #13 | Exceptional $67,353 |
| Okinawans | 100.0 /100 | #14 | Exceptional $67,232 |
| Immigrants | Eastern Asia | 100.0 /100 | #15 | Exceptional $66,903 |