Native/Alaskan vs Syrian Median Male Earnings
COMPARE
Native/Alaskan
Syrian
Median Male Earnings
Median Male Earnings Comparison
Natives/Alaskans
Syrians
$44,775
MEDIAN MALE EARNINGS
0.0/ 100
METRIC RATING
331st/ 347
METRIC RANK
$58,187
MEDIAN MALE EARNINGS
97.4/ 100
METRIC RATING
102nd/ 347
METRIC RANK
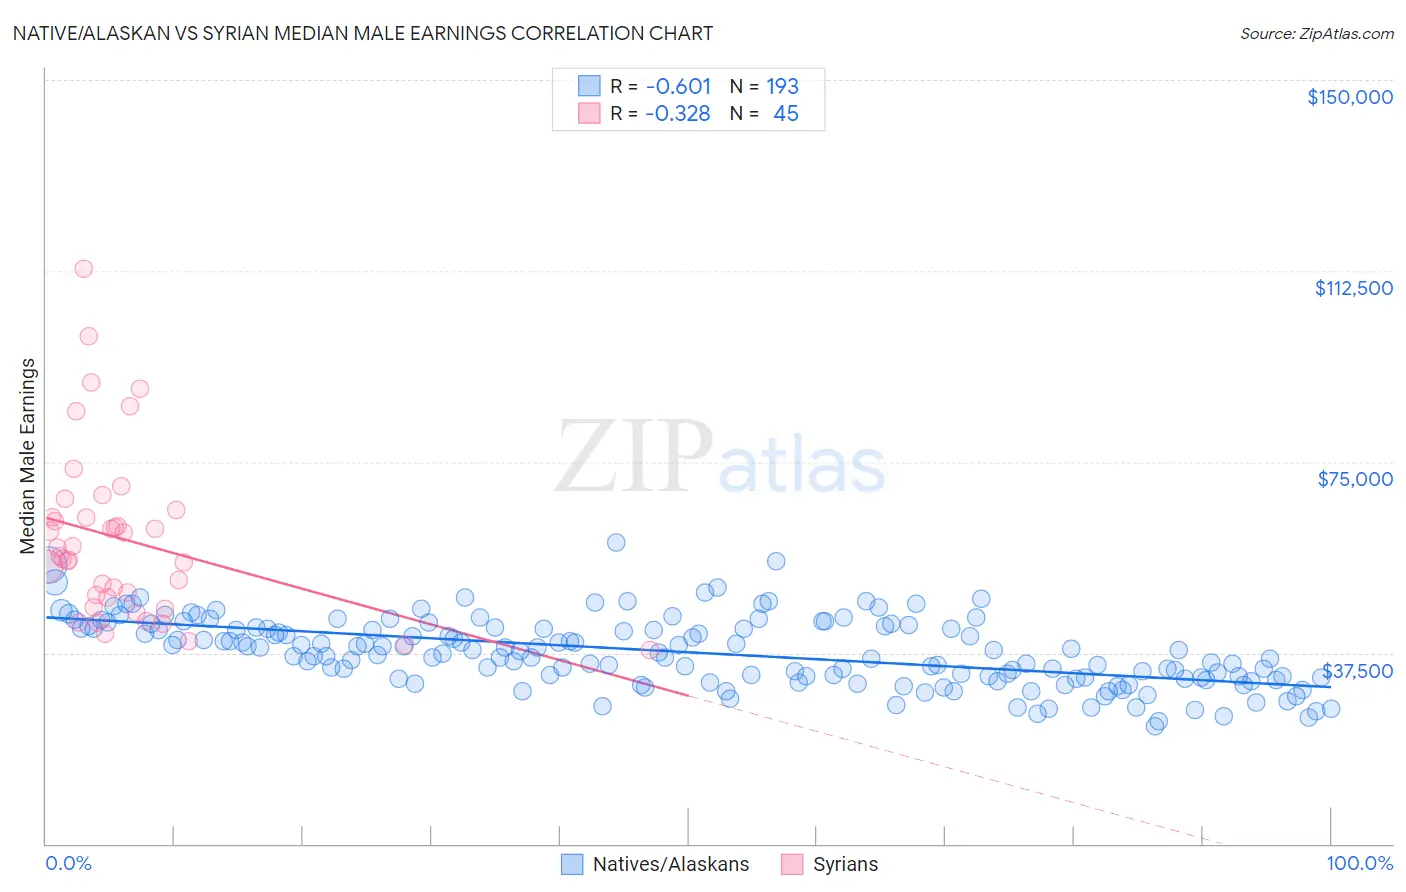
Native/Alaskan vs Syrian Median Male Earnings Correlation Chart
The statistical analysis conducted on geographies consisting of 512,408,867 people shows a significant negative correlation between the proportion of Natives/Alaskans and median male earnings in the United States with a correlation coefficient (R) of -0.601 and weighted average of $44,775. Similarly, the statistical analysis conducted on geographies consisting of 266,273,099 people shows a mild negative correlation between the proportion of Syrians and median male earnings in the United States with a correlation coefficient (R) of -0.328 and weighted average of $58,187, a difference of 29.9%.
Median Male Earnings Correlation Summary
| Measurement | Native/Alaskan | Syrian |
| Minimum | $23,050 | $38,125 |
| Maximum | $59,216 | $112,858 |
| Range | $36,166 | $74,733 |
| Mean | $37,642 | $59,779 |
| Median | $37,848 | $56,452 |
| Interquartile 25% (IQ1) | $32,642 | $47,297 |
| Interquartile 75% (IQ3) | $42,387 | $64,910 |
| Interquartile Range (IQR) | $9,745 | $17,614 |
| Standard Deviation (Sample) | $6,692 | $16,573 |
| Standard Deviation (Population) | $6,675 | $16,388 |
Similar Demographics by Median Male Earnings
Demographics Similar to Natives/Alaskans by Median Male Earnings
In terms of median male earnings, the demographic groups most similar to Natives/Alaskans are Bahamian ($44,756, a difference of 0.040%), Immigrants from Mexico ($44,960, a difference of 0.41%), Yakama ($45,002, a difference of 0.51%), Kiowa ($45,094, a difference of 0.71%), and Immigrants from Bahamas ($45,176, a difference of 0.90%).
| Demographics | Rating | Rank | Median Male Earnings |
| Blacks/African Americans | 0.0 /100 | #324 | Tragic $45,523 |
| Yuman | 0.0 /100 | #325 | Tragic $45,446 |
| Immigrants | Haiti | 0.0 /100 | #326 | Tragic $45,266 |
| Immigrants | Bahamas | 0.0 /100 | #327 | Tragic $45,176 |
| Kiowa | 0.0 /100 | #328 | Tragic $45,094 |
| Yakama | 0.0 /100 | #329 | Tragic $45,002 |
| Immigrants | Mexico | 0.0 /100 | #330 | Tragic $44,960 |
| Natives/Alaskans | 0.0 /100 | #331 | Tragic $44,775 |
| Bahamians | 0.0 /100 | #332 | Tragic $44,756 |
| Immigrants | Congo | 0.0 /100 | #333 | Tragic $44,204 |
| Immigrants | Yemen | 0.0 /100 | #334 | Tragic $44,083 |
| Spanish American Indians | 0.0 /100 | #335 | Tragic $44,010 |
| Immigrants | Cuba | 0.0 /100 | #336 | Tragic $43,461 |
| Menominee | 0.0 /100 | #337 | Tragic $42,581 |
| Crow | 0.0 /100 | #338 | Tragic $42,434 |
Demographics Similar to Syrians by Median Male Earnings
In terms of median male earnings, the demographic groups most similar to Syrians are Polish ($58,139, a difference of 0.080%), Armenian ($58,134, a difference of 0.090%), Immigrants from Western Asia ($58,131, a difference of 0.10%), Immigrants from Brazil ($58,324, a difference of 0.24%), and Immigrants from Northern Africa ($58,008, a difference of 0.31%).
| Demographics | Rating | Rank | Median Male Earnings |
| Immigrants | Lebanon | 98.6 /100 | #95 | Exceptional $58,835 |
| Albanians | 98.4 /100 | #96 | Exceptional $58,680 |
| Northern Europeans | 98.2 /100 | #97 | Exceptional $58,588 |
| Jordanians | 98.1 /100 | #98 | Exceptional $58,500 |
| Immigrants | Poland | 98.0 /100 | #99 | Exceptional $58,452 |
| Assyrians/Chaldeans/Syriacs | 97.9 /100 | #100 | Exceptional $58,437 |
| Immigrants | Brazil | 97.7 /100 | #101 | Exceptional $58,324 |
| Syrians | 97.4 /100 | #102 | Exceptional $58,187 |
| Poles | 97.3 /100 | #103 | Exceptional $58,139 |
| Armenians | 97.3 /100 | #104 | Exceptional $58,134 |
| Immigrants | Western Asia | 97.3 /100 | #105 | Exceptional $58,131 |
| Immigrants | Northern Africa | 96.9 /100 | #106 | Exceptional $58,008 |
| Serbians | 96.8 /100 | #107 | Exceptional $57,975 |
| Immigrants | Uzbekistan | 96.7 /100 | #108 | Exceptional $57,941 |
| British | 96.5 /100 | #109 | Exceptional $57,890 |