Native/Alaskan vs South African Median Male Earnings
COMPARE
Native/Alaskan
South African
Median Male Earnings
Median Male Earnings Comparison
Natives/Alaskans
South Africans
$44,775
MEDIAN MALE EARNINGS
0.0/ 100
METRIC RATING
331st/ 347
METRIC RANK
$61,460
MEDIAN MALE EARNINGS
99.9/ 100
METRIC RATING
53rd/ 347
METRIC RANK
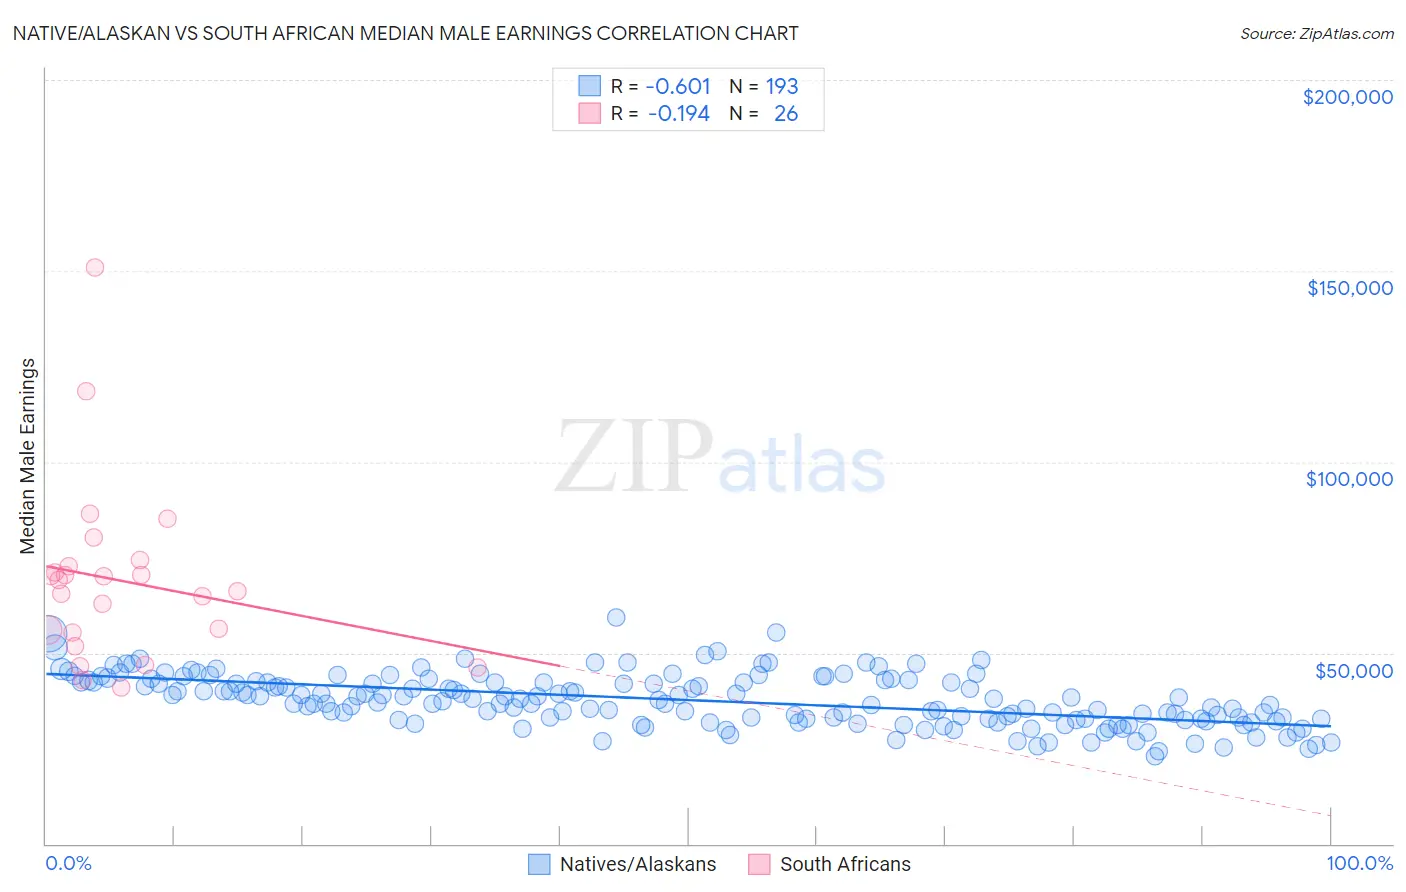
Native/Alaskan vs South African Median Male Earnings Correlation Chart
The statistical analysis conducted on geographies consisting of 512,408,867 people shows a significant negative correlation between the proportion of Natives/Alaskans and median male earnings in the United States with a correlation coefficient (R) of -0.601 and weighted average of $44,775. Similarly, the statistical analysis conducted on geographies consisting of 182,591,048 people shows a poor negative correlation between the proportion of South Africans and median male earnings in the United States with a correlation coefficient (R) of -0.194 and weighted average of $61,460, a difference of 37.3%.
Median Male Earnings Correlation Summary
| Measurement | Native/Alaskan | South African |
| Minimum | $23,050 | $40,972 |
| Maximum | $59,216 | $150,965 |
| Range | $36,166 | $109,993 |
| Mean | $37,642 | $68,892 |
| Median | $37,848 | $67,477 |
| Interquartile 25% (IQ1) | $32,642 | $55,347 |
| Interquartile 75% (IQ3) | $42,387 | $72,701 |
| Interquartile Range (IQR) | $9,745 | $17,354 |
| Standard Deviation (Sample) | $6,692 | $23,483 |
| Standard Deviation (Population) | $6,675 | $23,027 |
Similar Demographics by Median Male Earnings
Demographics Similar to Natives/Alaskans by Median Male Earnings
In terms of median male earnings, the demographic groups most similar to Natives/Alaskans are Bahamian ($44,756, a difference of 0.040%), Immigrants from Mexico ($44,960, a difference of 0.41%), Yakama ($45,002, a difference of 0.51%), Kiowa ($45,094, a difference of 0.71%), and Immigrants from Bahamas ($45,176, a difference of 0.90%).
| Demographics | Rating | Rank | Median Male Earnings |
| Blacks/African Americans | 0.0 /100 | #324 | Tragic $45,523 |
| Yuman | 0.0 /100 | #325 | Tragic $45,446 |
| Immigrants | Haiti | 0.0 /100 | #326 | Tragic $45,266 |
| Immigrants | Bahamas | 0.0 /100 | #327 | Tragic $45,176 |
| Kiowa | 0.0 /100 | #328 | Tragic $45,094 |
| Yakama | 0.0 /100 | #329 | Tragic $45,002 |
| Immigrants | Mexico | 0.0 /100 | #330 | Tragic $44,960 |
| Natives/Alaskans | 0.0 /100 | #331 | Tragic $44,775 |
| Bahamians | 0.0 /100 | #332 | Tragic $44,756 |
| Immigrants | Congo | 0.0 /100 | #333 | Tragic $44,204 |
| Immigrants | Yemen | 0.0 /100 | #334 | Tragic $44,083 |
| Spanish American Indians | 0.0 /100 | #335 | Tragic $44,010 |
| Immigrants | Cuba | 0.0 /100 | #336 | Tragic $43,461 |
| Menominee | 0.0 /100 | #337 | Tragic $42,581 |
| Crow | 0.0 /100 | #338 | Tragic $42,434 |
Demographics Similar to South Africans by Median Male Earnings
In terms of median male earnings, the demographic groups most similar to South Africans are Immigrants from Latvia ($61,422, a difference of 0.060%), Immigrants from Norway ($61,628, a difference of 0.27%), Greek ($61,242, a difference of 0.36%), Lithuanian ($61,228, a difference of 0.38%), and Immigrants from Scotland ($61,220, a difference of 0.39%).
| Demographics | Rating | Rank | Median Male Earnings |
| Immigrants | Czechoslovakia | 99.9 /100 | #46 | Exceptional $62,217 |
| Immigrants | Austria | 99.9 /100 | #47 | Exceptional $62,164 |
| Immigrants | Malaysia | 99.9 /100 | #48 | Exceptional $62,121 |
| Immigrants | Europe | 99.9 /100 | #49 | Exceptional $62,057 |
| Bhutanese | 99.9 /100 | #50 | Exceptional $61,759 |
| Estonians | 99.9 /100 | #51 | Exceptional $61,710 |
| Immigrants | Norway | 99.9 /100 | #52 | Exceptional $61,628 |
| South Africans | 99.9 /100 | #53 | Exceptional $61,460 |
| Immigrants | Latvia | 99.9 /100 | #54 | Exceptional $61,422 |
| Greeks | 99.9 /100 | #55 | Exceptional $61,242 |
| Lithuanians | 99.9 /100 | #56 | Exceptional $61,228 |
| Immigrants | Scotland | 99.9 /100 | #57 | Exceptional $61,220 |
| New Zealanders | 99.9 /100 | #58 | Exceptional $61,199 |
| Immigrants | Netherlands | 99.8 /100 | #59 | Exceptional $61,096 |
| Egyptians | 99.8 /100 | #60 | Exceptional $61,095 |