Tsimshian vs Immigrants from Hong Kong Median Male Earnings
COMPARE
Tsimshian
Immigrants from Hong Kong
Median Male Earnings
Median Male Earnings Comparison
Tsimshian
Immigrants from Hong Kong
$48,836
MEDIAN MALE EARNINGS
0.4/ 100
METRIC RATING
269th/ 347
METRIC RANK
$70,146
MEDIAN MALE EARNINGS
100.0/ 100
METRIC RATING
7th/ 347
METRIC RANK
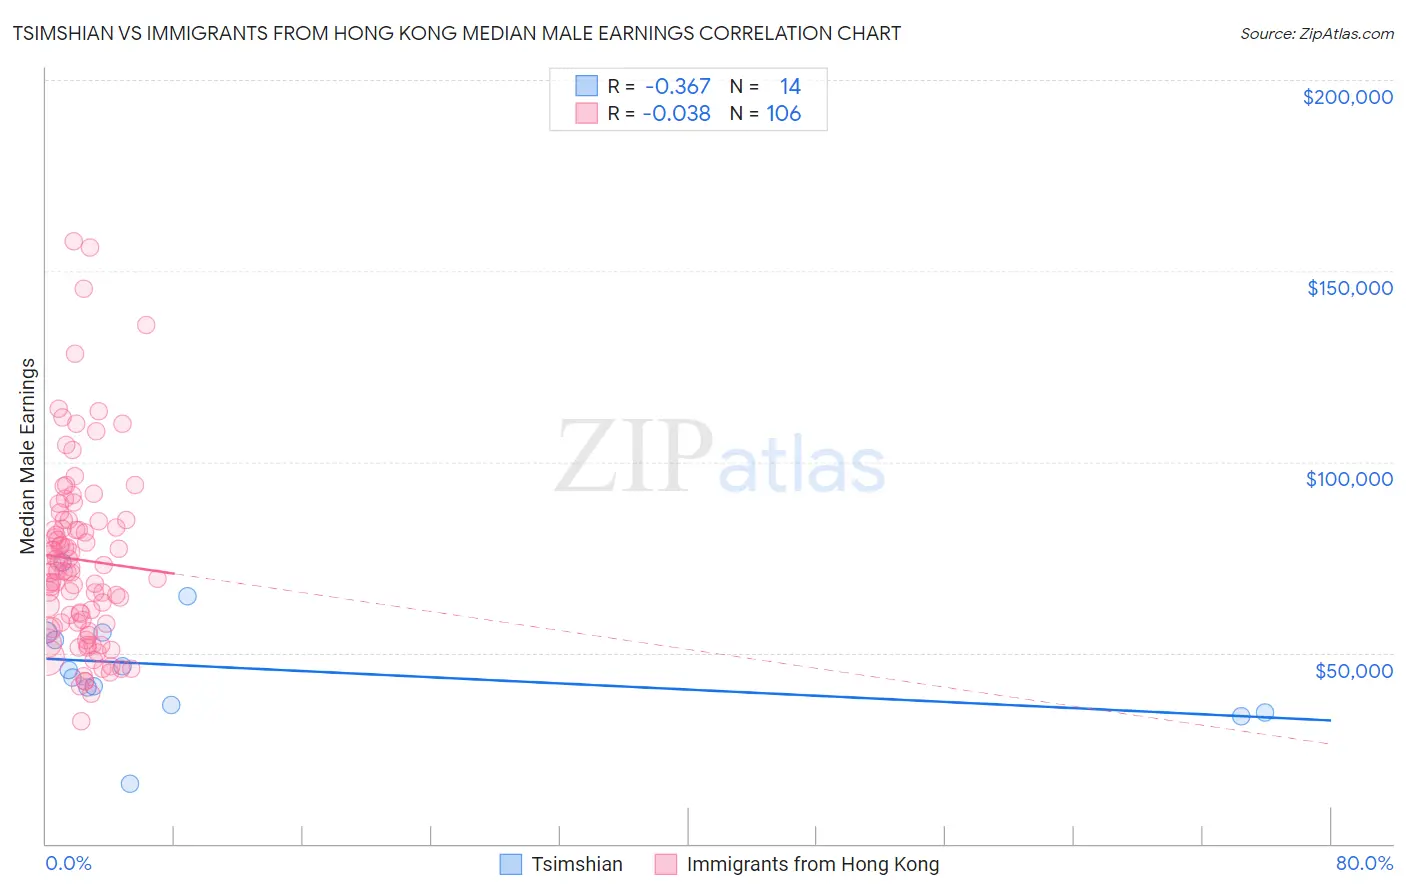
Tsimshian vs Immigrants from Hong Kong Median Male Earnings Correlation Chart
The statistical analysis conducted on geographies consisting of 15,625,423 people shows a mild negative correlation between the proportion of Tsimshian and median male earnings in the United States with a correlation coefficient (R) of -0.367 and weighted average of $48,836. Similarly, the statistical analysis conducted on geographies consisting of 253,977,205 people shows no correlation between the proportion of Immigrants from Hong Kong and median male earnings in the United States with a correlation coefficient (R) of -0.038 and weighted average of $70,146, a difference of 43.6%.
Median Male Earnings Correlation Summary
| Measurement | Tsimshian | Immigrants from Hong Kong |
| Minimum | $15,625 | $31,993 |
| Maximum | $73,588 | $157,888 |
| Range | $57,963 | $125,895 |
| Mean | $45,710 | $74,359 |
| Median | $44,489 | $71,506 |
| Interquartile 25% (IQ1) | $36,250 | $57,587 |
| Interquartile 75% (IQ3) | $55,386 | $84,451 |
| Interquartile Range (IQR) | $19,136 | $26,864 |
| Standard Deviation (Sample) | $14,437 | $24,045 |
| Standard Deviation (Population) | $13,911 | $23,931 |
Similar Demographics by Median Male Earnings
Demographics Similar to Tsimshian by Median Male Earnings
In terms of median male earnings, the demographic groups most similar to Tsimshian are Ute ($48,899, a difference of 0.13%), Potawatomi ($48,768, a difference of 0.14%), Cherokee ($48,669, a difference of 0.34%), Spanish American ($49,008, a difference of 0.35%), and Somali ($49,025, a difference of 0.39%).
| Demographics | Rating | Rank | Median Male Earnings |
| Immigrants | West Indies | 0.6 /100 | #262 | Tragic $49,271 |
| Nicaraguans | 0.6 /100 | #263 | Tragic $49,215 |
| Immigrants | Middle Africa | 0.6 /100 | #264 | Tragic $49,201 |
| Immigrants | Laos | 0.6 /100 | #265 | Tragic $49,190 |
| Somalis | 0.5 /100 | #266 | Tragic $49,025 |
| Spanish Americans | 0.5 /100 | #267 | Tragic $49,008 |
| Ute | 0.4 /100 | #268 | Tragic $48,899 |
| Tsimshian | 0.4 /100 | #269 | Tragic $48,836 |
| Potawatomi | 0.4 /100 | #270 | Tragic $48,768 |
| Cherokee | 0.3 /100 | #271 | Tragic $48,669 |
| Salvadorans | 0.3 /100 | #272 | Tragic $48,646 |
| Jamaicans | 0.3 /100 | #273 | Tragic $48,632 |
| Colville | 0.3 /100 | #274 | Tragic $48,516 |
| Immigrants | Somalia | 0.3 /100 | #275 | Tragic $48,439 |
| Blackfeet | 0.3 /100 | #276 | Tragic $48,402 |
Demographics Similar to Immigrants from Hong Kong by Median Male Earnings
In terms of median male earnings, the demographic groups most similar to Immigrants from Hong Kong are Iranian ($70,648, a difference of 0.72%), Immigrants from Iran ($69,284, a difference of 1.2%), Immigrants from Singapore ($71,348, a difference of 1.7%), Immigrants from South Central Asia ($68,960, a difference of 1.7%), and Immigrants from Israel ($68,716, a difference of 2.1%).
| Demographics | Rating | Rank | Median Male Earnings |
| Filipinos | 100.0 /100 | #1 | Exceptional $74,224 |
| Immigrants | India | 100.0 /100 | #2 | Exceptional $74,207 |
| Immigrants | Taiwan | 100.0 /100 | #3 | Exceptional $74,031 |
| Thais | 100.0 /100 | #4 | Exceptional $72,135 |
| Immigrants | Singapore | 100.0 /100 | #5 | Exceptional $71,348 |
| Iranians | 100.0 /100 | #6 | Exceptional $70,648 |
| Immigrants | Hong Kong | 100.0 /100 | #7 | Exceptional $70,146 |
| Immigrants | Iran | 100.0 /100 | #8 | Exceptional $69,284 |
| Immigrants | South Central Asia | 100.0 /100 | #9 | Exceptional $68,960 |
| Immigrants | Israel | 100.0 /100 | #10 | Exceptional $68,716 |
| Immigrants | Ireland | 100.0 /100 | #11 | Exceptional $67,698 |
| Immigrants | Australia | 100.0 /100 | #12 | Exceptional $67,634 |
| Immigrants | China | 100.0 /100 | #13 | Exceptional $67,353 |
| Okinawans | 100.0 /100 | #14 | Exceptional $67,232 |
| Immigrants | Eastern Asia | 100.0 /100 | #15 | Exceptional $66,903 |