Turkish vs Immigrants from Hong Kong Median Male Earnings
COMPARE
Turkish
Immigrants from Hong Kong
Median Male Earnings
Median Male Earnings Comparison
Turks
Immigrants from Hong Kong
$64,253
MEDIAN MALE EARNINGS
100.0/ 100
METRIC RATING
26th/ 347
METRIC RANK
$70,146
MEDIAN MALE EARNINGS
100.0/ 100
METRIC RATING
7th/ 347
METRIC RANK
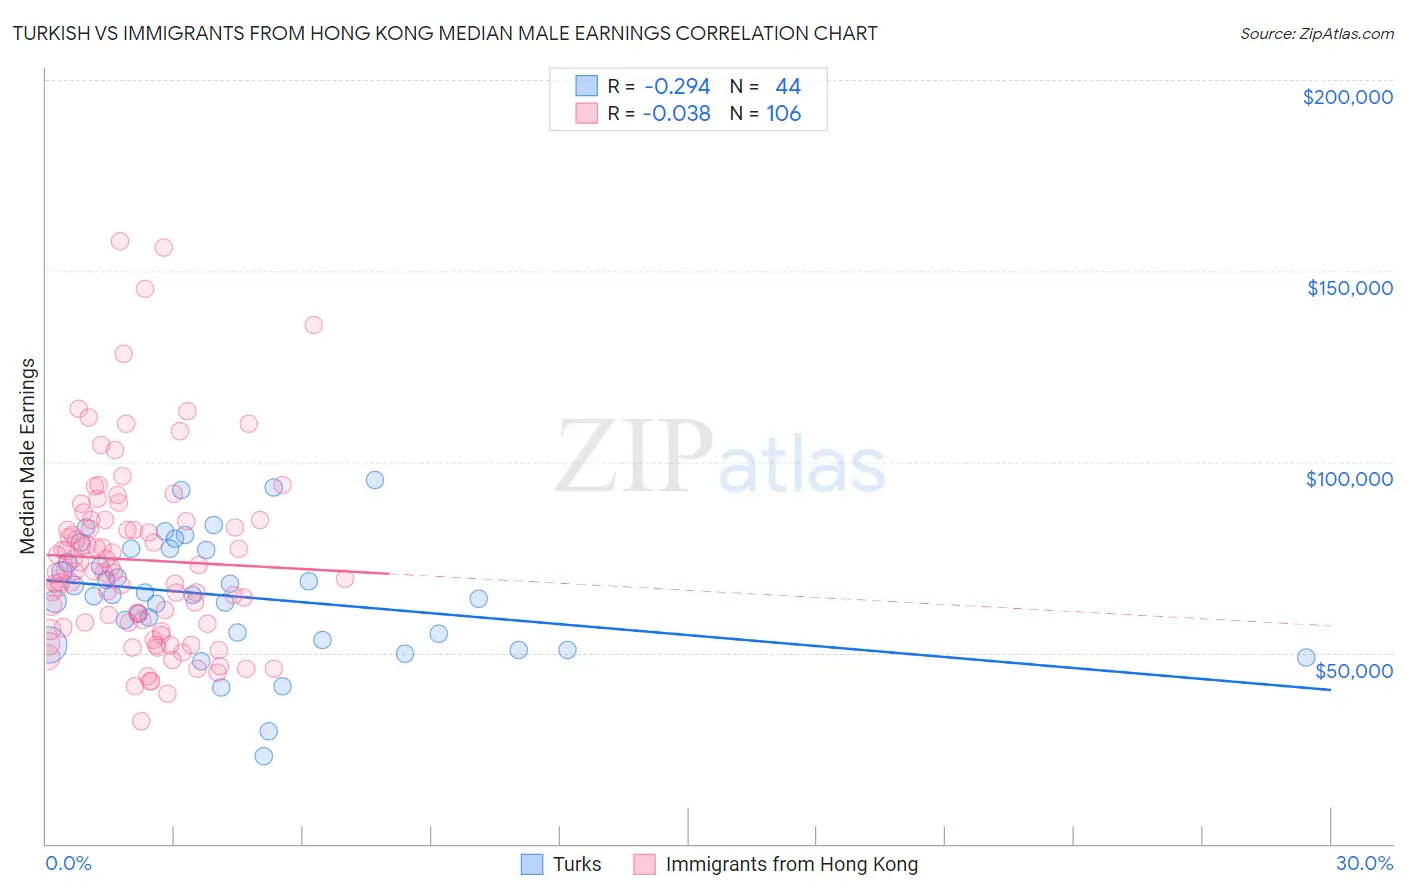
Turkish vs Immigrants from Hong Kong Median Male Earnings Correlation Chart
The statistical analysis conducted on geographies consisting of 271,821,901 people shows a weak negative correlation between the proportion of Turks and median male earnings in the United States with a correlation coefficient (R) of -0.294 and weighted average of $64,253. Similarly, the statistical analysis conducted on geographies consisting of 253,977,205 people shows no correlation between the proportion of Immigrants from Hong Kong and median male earnings in the United States with a correlation coefficient (R) of -0.038 and weighted average of $70,146, a difference of 9.2%.
Median Male Earnings Correlation Summary
| Measurement | Turkish | Immigrants from Hong Kong |
| Minimum | $22,917 | $31,993 |
| Maximum | $95,313 | $157,888 |
| Range | $72,396 | $125,895 |
| Mean | $64,813 | $74,359 |
| Median | $65,160 | $71,506 |
| Interquartile 25% (IQ1) | $54,093 | $57,587 |
| Interquartile 75% (IQ3) | $77,144 | $84,451 |
| Interquartile Range (IQR) | $23,051 | $26,864 |
| Standard Deviation (Sample) | $15,821 | $24,045 |
| Standard Deviation (Population) | $15,640 | $23,931 |
Demographics Similar to Turks and Immigrants from Hong Kong by Median Male Earnings
In terms of median male earnings, the demographic groups most similar to Turks are Immigrants from Denmark ($64,625, a difference of 0.58%), Immigrants from Northern Europe ($64,987, a difference of 1.1%), Immigrants from Korea ($65,079, a difference of 1.3%), Burmese ($65,236, a difference of 1.5%), and Immigrants from Sweden ($65,406, a difference of 1.8%). Similarly, the demographic groups most similar to Immigrants from Hong Kong are Iranian ($70,648, a difference of 0.72%), Immigrants from Iran ($69,284, a difference of 1.2%), Immigrants from South Central Asia ($68,960, a difference of 1.7%), Immigrants from Israel ($68,716, a difference of 2.1%), and Immigrants from Ireland ($67,698, a difference of 3.6%).
| Demographics | Rating | Rank | Median Male Earnings |
| Iranians | 100.0 /100 | #6 | Exceptional $70,648 |
| Immigrants | Hong Kong | 100.0 /100 | #7 | Exceptional $70,146 |
| Immigrants | Iran | 100.0 /100 | #8 | Exceptional $69,284 |
| Immigrants | South Central Asia | 100.0 /100 | #9 | Exceptional $68,960 |
| Immigrants | Israel | 100.0 /100 | #10 | Exceptional $68,716 |
| Immigrants | Ireland | 100.0 /100 | #11 | Exceptional $67,698 |
| Immigrants | Australia | 100.0 /100 | #12 | Exceptional $67,634 |
| Immigrants | China | 100.0 /100 | #13 | Exceptional $67,353 |
| Okinawans | 100.0 /100 | #14 | Exceptional $67,232 |
| Immigrants | Eastern Asia | 100.0 /100 | #15 | Exceptional $66,903 |
| Eastern Europeans | 100.0 /100 | #16 | Exceptional $66,472 |
| Immigrants | Belgium | 100.0 /100 | #17 | Exceptional $66,125 |
| Indians (Asian) | 100.0 /100 | #18 | Exceptional $66,078 |
| Cypriots | 100.0 /100 | #19 | Exceptional $65,549 |
| Immigrants | Japan | 100.0 /100 | #20 | Exceptional $65,518 |
| Immigrants | Sweden | 100.0 /100 | #21 | Exceptional $65,406 |
| Burmese | 100.0 /100 | #22 | Exceptional $65,236 |
| Immigrants | Korea | 100.0 /100 | #23 | Exceptional $65,079 |
| Immigrants | Northern Europe | 100.0 /100 | #24 | Exceptional $64,987 |
| Immigrants | Denmark | 100.0 /100 | #25 | Exceptional $64,625 |
| Turks | 100.0 /100 | #26 | Exceptional $64,253 |