Native/Alaskan vs Immigrants from Hong Kong Child Poverty Under the Age of 5
COMPARE
Native/Alaskan
Immigrants from Hong Kong
Child Poverty Under the Age of 5
Child Poverty Under the Age of 5 Comparison
Natives/Alaskans
Immigrants from Hong Kong
25.6%
CHILD POVERTY UNDER THE AGE OF 5
0.0/ 100
METRIC RATING
333rd/ 347
METRIC RANK
12.4%
CHILD POVERTY UNDER THE AGE OF 5
100.0/ 100
METRIC RATING
5th/ 347
METRIC RANK
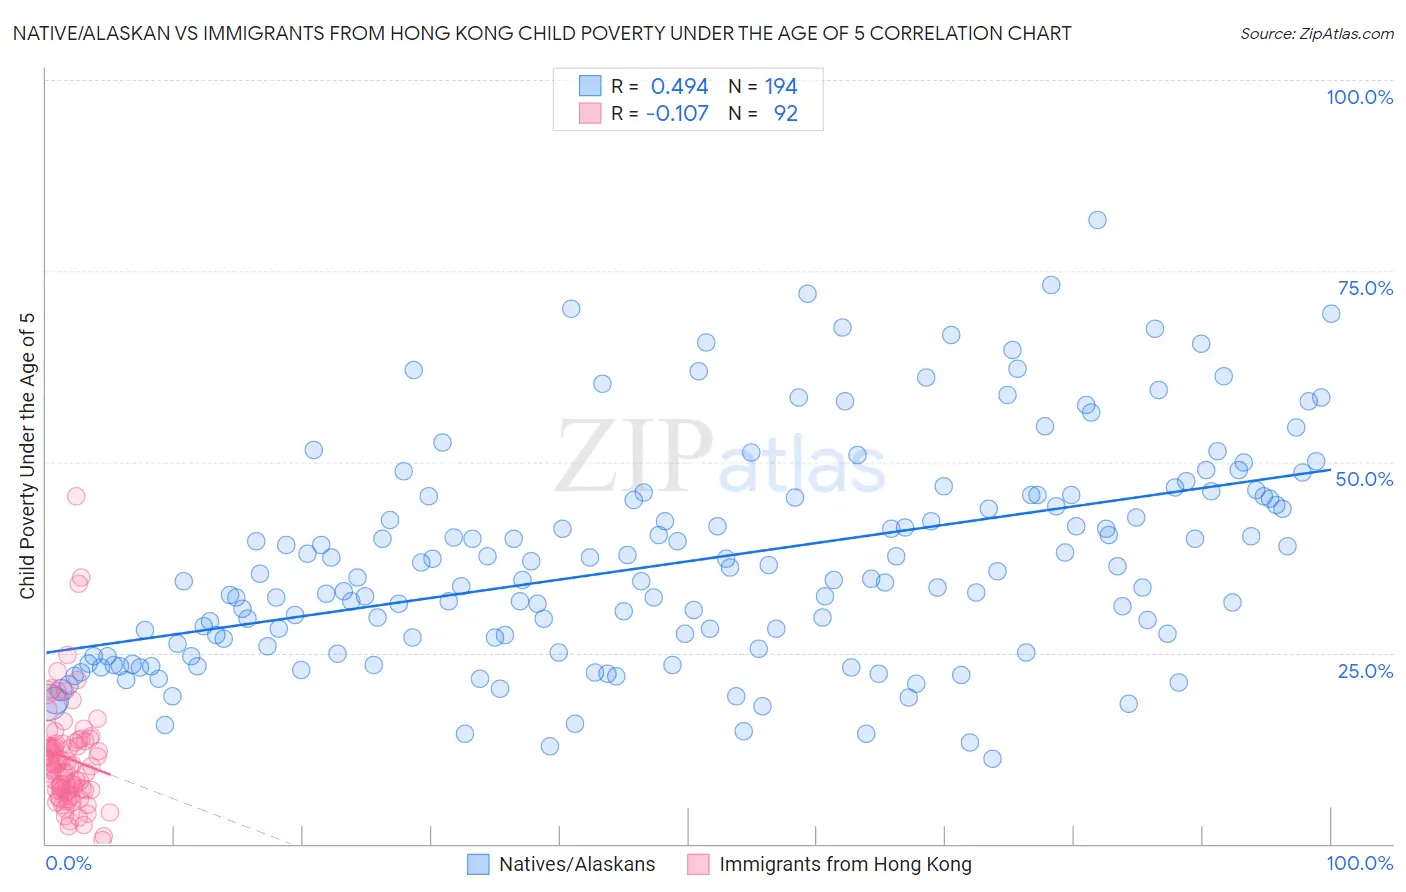
Native/Alaskan vs Immigrants from Hong Kong Child Poverty Under the Age of 5 Correlation Chart
The statistical analysis conducted on geographies consisting of 489,584,863 people shows a moderate positive correlation between the proportion of Natives/Alaskans and poverty level among children under the age of 5 in the United States with a correlation coefficient (R) of 0.494 and weighted average of 25.6%. Similarly, the statistical analysis conducted on geographies consisting of 244,450,571 people shows a poor negative correlation between the proportion of Immigrants from Hong Kong and poverty level among children under the age of 5 in the United States with a correlation coefficient (R) of -0.107 and weighted average of 12.4%, a difference of 105.6%.
Child Poverty Under the Age of 5 Correlation Summary
| Measurement | Native/Alaskan | Immigrants from Hong Kong |
| Minimum | 11.1% | 0.42% |
| Maximum | 81.6% | 45.5% |
| Range | 70.5% | 45.0% |
| Mean | 36.9% | 11.1% |
| Median | 34.6% | 10.1% |
| Interquartile 25% (IQ1) | 25.6% | 7.0% |
| Interquartile 75% (IQ3) | 45.5% | 13.2% |
| Interquartile Range (IQR) | 19.9% | 6.2% |
| Standard Deviation (Sample) | 14.2% | 7.1% |
| Standard Deviation (Population) | 14.2% | 7.0% |
Similar Demographics by Child Poverty Under the Age of 5
Demographics Similar to Natives/Alaskans by Child Poverty Under the Age of 5
In terms of child poverty under the age of 5, the demographic groups most similar to Natives/Alaskans are Black/African American (25.7%, a difference of 0.50%), Colville (25.7%, a difference of 0.50%), Apache (25.0%, a difference of 2.2%), Kiowa (24.5%, a difference of 4.5%), and Sioux (26.9%, a difference of 5.4%).
| Demographics | Rating | Rank | Child Poverty Under the Age of 5 |
| Central American Indians | 0.0 /100 | #326 | Tragic 23.9% |
| Dominicans | 0.0 /100 | #327 | Tragic 24.0% |
| Immigrants | Dominican Republic | 0.0 /100 | #328 | Tragic 24.1% |
| Cajuns | 0.0 /100 | #329 | Tragic 24.1% |
| Creek | 0.0 /100 | #330 | Tragic 24.2% |
| Kiowa | 0.0 /100 | #331 | Tragic 24.5% |
| Apache | 0.0 /100 | #332 | Tragic 25.0% |
| Natives/Alaskans | 0.0 /100 | #333 | Tragic 25.6% |
| Blacks/African Americans | 0.0 /100 | #334 | Tragic 25.7% |
| Colville | 0.0 /100 | #335 | Tragic 25.7% |
| Sioux | 0.0 /100 | #336 | Tragic 26.9% |
| Pima | 0.0 /100 | #337 | Tragic 27.4% |
| Hopi | 0.0 /100 | #338 | Tragic 27.7% |
| Yup'ik | 0.0 /100 | #339 | Tragic 27.7% |
| Cheyenne | 0.0 /100 | #340 | Tragic 28.3% |
Demographics Similar to Immigrants from Hong Kong by Child Poverty Under the Age of 5
In terms of child poverty under the age of 5, the demographic groups most similar to Immigrants from Hong Kong are Thai (12.3%, a difference of 1.0%), Immigrants from Singapore (12.9%, a difference of 4.0%), Chinese (13.1%, a difference of 5.1%), Iranian (13.1%, a difference of 5.1%), and Immigrants from Iran (13.1%, a difference of 5.2%).
| Demographics | Rating | Rank | Child Poverty Under the Age of 5 |
| Immigrants | India | 100.0 /100 | #1 | Exceptional 11.5% |
| Immigrants | Taiwan | 100.0 /100 | #2 | Exceptional 11.6% |
| Filipinos | 100.0 /100 | #3 | Exceptional 11.6% |
| Thais | 100.0 /100 | #4 | Exceptional 12.3% |
| Immigrants | Hong Kong | 100.0 /100 | #5 | Exceptional 12.4% |
| Immigrants | Singapore | 100.0 /100 | #6 | Exceptional 12.9% |
| Chinese | 100.0 /100 | #7 | Exceptional 13.1% |
| Iranians | 100.0 /100 | #8 | Exceptional 13.1% |
| Immigrants | Iran | 100.0 /100 | #9 | Exceptional 13.1% |
| Burmese | 100.0 /100 | #10 | Exceptional 13.2% |
| Immigrants | Korea | 100.0 /100 | #11 | Exceptional 13.2% |
| Immigrants | South Central Asia | 100.0 /100 | #12 | Exceptional 13.3% |
| Bhutanese | 100.0 /100 | #13 | Exceptional 13.4% |
| Okinawans | 100.0 /100 | #14 | Exceptional 13.4% |
| Indians (Asian) | 100.0 /100 | #15 | Exceptional 13.4% |