Native/Alaskan vs South American Median Male Earnings
COMPARE
Native/Alaskan
South American
Median Male Earnings
Median Male Earnings Comparison
Natives/Alaskans
South Americans
$44,775
MEDIAN MALE EARNINGS
0.0/ 100
METRIC RATING
331st/ 347
METRIC RANK
$54,492
MEDIAN MALE EARNINGS
50.0/ 100
METRIC RATING
174th/ 347
METRIC RANK
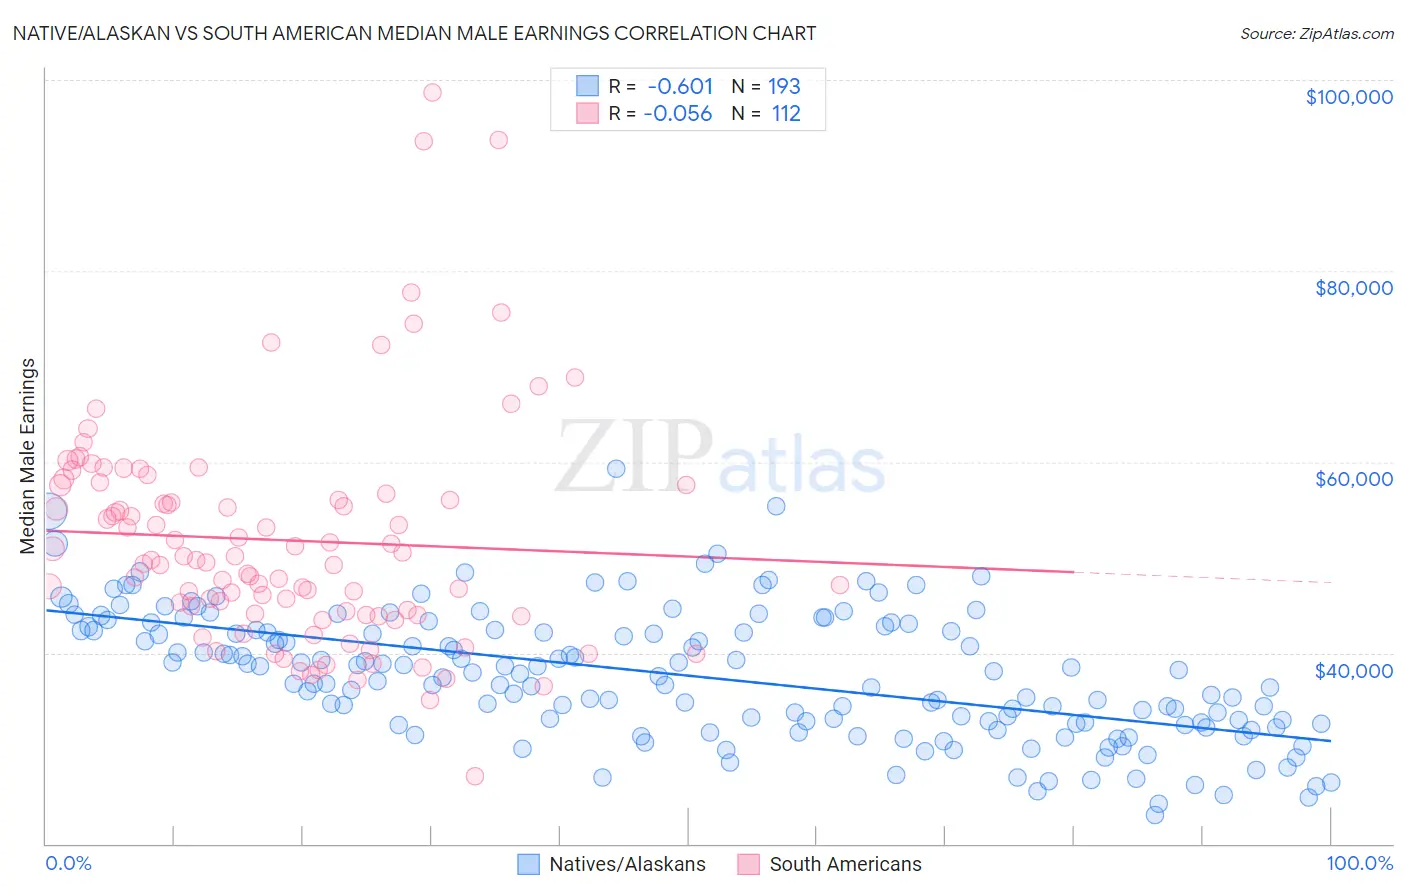
Native/Alaskan vs South American Median Male Earnings Correlation Chart
The statistical analysis conducted on geographies consisting of 512,408,867 people shows a significant negative correlation between the proportion of Natives/Alaskans and median male earnings in the United States with a correlation coefficient (R) of -0.601 and weighted average of $44,775. Similarly, the statistical analysis conducted on geographies consisting of 493,870,370 people shows a slight negative correlation between the proportion of South Americans and median male earnings in the United States with a correlation coefficient (R) of -0.056 and weighted average of $54,492, a difference of 21.7%.
Median Male Earnings Correlation Summary
| Measurement | Native/Alaskan | South American |
| Minimum | $23,050 | $27,125 |
| Maximum | $59,216 | $98,656 |
| Range | $36,166 | $71,531 |
| Mean | $37,642 | $51,788 |
| Median | $37,848 | $49,715 |
| Interquartile 25% (IQ1) | $32,642 | $44,028 |
| Interquartile 75% (IQ3) | $42,387 | $57,077 |
| Interquartile Range (IQR) | $9,745 | $13,050 |
| Standard Deviation (Sample) | $6,692 | $11,850 |
| Standard Deviation (Population) | $6,675 | $11,797 |
Similar Demographics by Median Male Earnings
Demographics Similar to Natives/Alaskans by Median Male Earnings
In terms of median male earnings, the demographic groups most similar to Natives/Alaskans are Bahamian ($44,756, a difference of 0.040%), Immigrants from Mexico ($44,960, a difference of 0.41%), Yakama ($45,002, a difference of 0.51%), Kiowa ($45,094, a difference of 0.71%), and Immigrants from Bahamas ($45,176, a difference of 0.90%).
| Demographics | Rating | Rank | Median Male Earnings |
| Blacks/African Americans | 0.0 /100 | #324 | Tragic $45,523 |
| Yuman | 0.0 /100 | #325 | Tragic $45,446 |
| Immigrants | Haiti | 0.0 /100 | #326 | Tragic $45,266 |
| Immigrants | Bahamas | 0.0 /100 | #327 | Tragic $45,176 |
| Kiowa | 0.0 /100 | #328 | Tragic $45,094 |
| Yakama | 0.0 /100 | #329 | Tragic $45,002 |
| Immigrants | Mexico | 0.0 /100 | #330 | Tragic $44,960 |
| Natives/Alaskans | 0.0 /100 | #331 | Tragic $44,775 |
| Bahamians | 0.0 /100 | #332 | Tragic $44,756 |
| Immigrants | Congo | 0.0 /100 | #333 | Tragic $44,204 |
| Immigrants | Yemen | 0.0 /100 | #334 | Tragic $44,083 |
| Spanish American Indians | 0.0 /100 | #335 | Tragic $44,010 |
| Immigrants | Cuba | 0.0 /100 | #336 | Tragic $43,461 |
| Menominee | 0.0 /100 | #337 | Tragic $42,581 |
| Crow | 0.0 /100 | #338 | Tragic $42,434 |
Demographics Similar to South Americans by Median Male Earnings
In terms of median male earnings, the demographic groups most similar to South Americans are South American Indian ($54,508, a difference of 0.030%), Dutch ($54,410, a difference of 0.15%), Spaniard ($54,401, a difference of 0.17%), Welsh ($54,647, a difference of 0.28%), and Immigrants from Peru ($54,695, a difference of 0.37%).
| Demographics | Rating | Rank | Median Male Earnings |
| Immigrants | Fiji | 61.2 /100 | #167 | Good $54,958 |
| Immigrants | Vietnam | 60.2 /100 | #168 | Good $54,913 |
| French Canadians | 55.6 /100 | #169 | Average $54,722 |
| Finns | 55.6 /100 | #170 | Average $54,721 |
| Immigrants | Peru | 54.9 /100 | #171 | Average $54,695 |
| Welsh | 53.8 /100 | #172 | Average $54,647 |
| South American Indians | 50.4 /100 | #173 | Average $54,508 |
| South Americans | 50.0 /100 | #174 | Average $54,492 |
| Dutch | 48.0 /100 | #175 | Average $54,410 |
| Spaniards | 47.8 /100 | #176 | Average $54,401 |
| Costa Ricans | 44.8 /100 | #177 | Average $54,279 |
| Sierra Leoneans | 44.8 /100 | #178 | Average $54,279 |
| Celtics | 43.9 /100 | #179 | Average $54,242 |
| Iraqis | 42.5 /100 | #180 | Average $54,182 |
| Immigrants | Immigrants | 42.1 /100 | #181 | Average $54,168 |