Native/Alaskan vs Immigrants from Costa Rica Median Male Earnings
COMPARE
Native/Alaskan
Immigrants from Costa Rica
Median Male Earnings
Median Male Earnings Comparison
Natives/Alaskans
Immigrants from Costa Rica
$44,775
MEDIAN MALE EARNINGS
0.0/ 100
METRIC RATING
331st/ 347
METRIC RANK
$53,237
MEDIAN MALE EARNINGS
22.6/ 100
METRIC RATING
198th/ 347
METRIC RANK
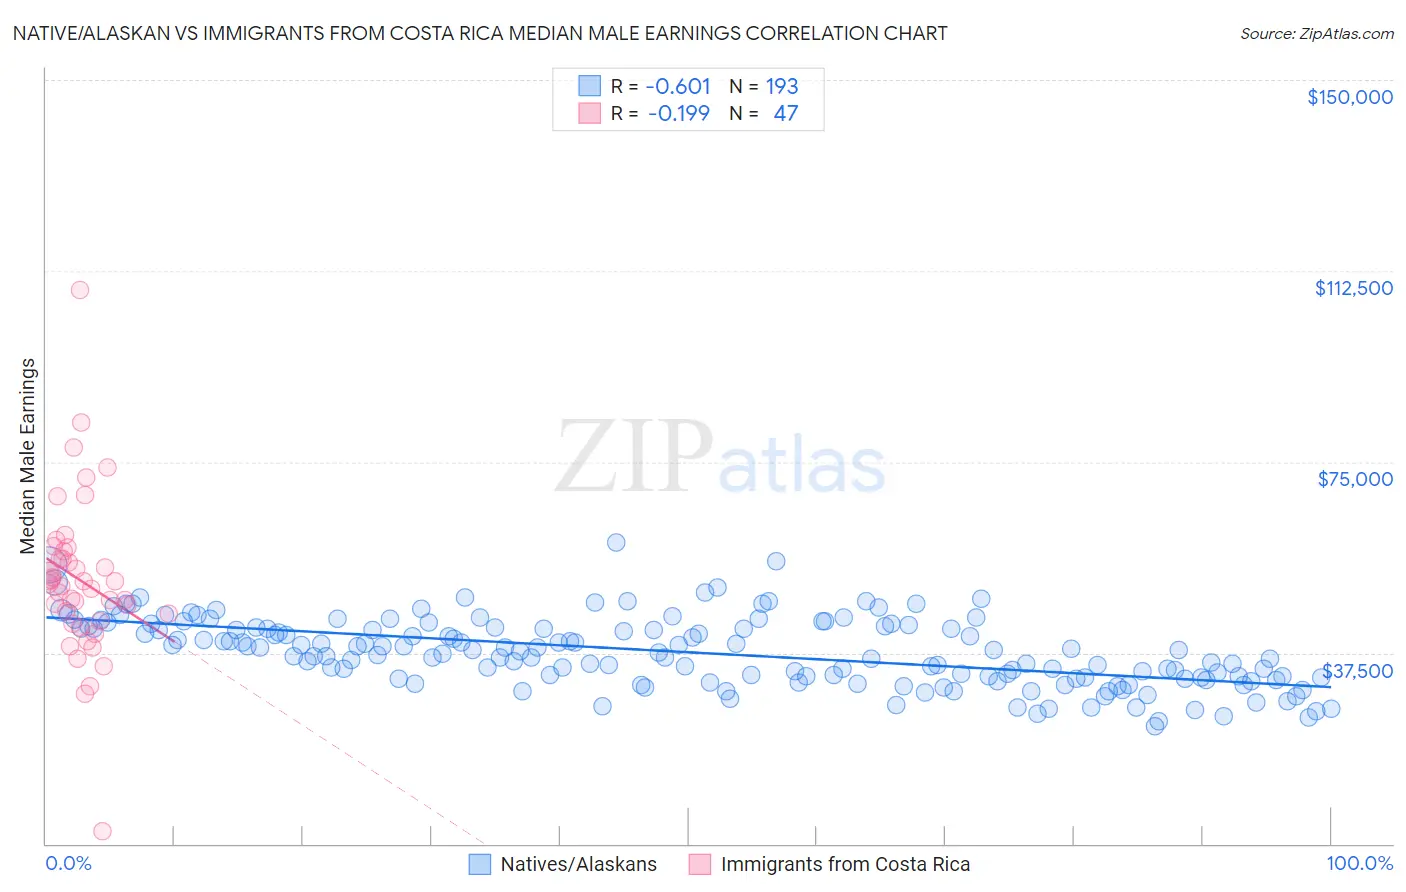
Native/Alaskan vs Immigrants from Costa Rica Median Male Earnings Correlation Chart
The statistical analysis conducted on geographies consisting of 512,408,867 people shows a significant negative correlation between the proportion of Natives/Alaskans and median male earnings in the United States with a correlation coefficient (R) of -0.601 and weighted average of $44,775. Similarly, the statistical analysis conducted on geographies consisting of 204,258,977 people shows a poor negative correlation between the proportion of Immigrants from Costa Rica and median male earnings in the United States with a correlation coefficient (R) of -0.199 and weighted average of $53,237, a difference of 18.9%.
Median Male Earnings Correlation Summary
| Measurement | Native/Alaskan | Immigrants from Costa Rica |
| Minimum | $23,050 | $2,499 |
| Maximum | $59,216 | $108,694 |
| Range | $36,166 | $106,195 |
| Mean | $37,642 | $51,781 |
| Median | $37,848 | $51,130 |
| Interquartile 25% (IQ1) | $32,642 | $43,645 |
| Interquartile 75% (IQ3) | $42,387 | $57,328 |
| Interquartile Range (IQR) | $9,745 | $13,682 |
| Standard Deviation (Sample) | $6,692 | $15,839 |
| Standard Deviation (Population) | $6,675 | $15,669 |
Similar Demographics by Median Male Earnings
Demographics Similar to Natives/Alaskans by Median Male Earnings
In terms of median male earnings, the demographic groups most similar to Natives/Alaskans are Bahamian ($44,756, a difference of 0.040%), Immigrants from Mexico ($44,960, a difference of 0.41%), Yakama ($45,002, a difference of 0.51%), Kiowa ($45,094, a difference of 0.71%), and Immigrants from Bahamas ($45,176, a difference of 0.90%).
| Demographics | Rating | Rank | Median Male Earnings |
| Blacks/African Americans | 0.0 /100 | #324 | Tragic $45,523 |
| Yuman | 0.0 /100 | #325 | Tragic $45,446 |
| Immigrants | Haiti | 0.0 /100 | #326 | Tragic $45,266 |
| Immigrants | Bahamas | 0.0 /100 | #327 | Tragic $45,176 |
| Kiowa | 0.0 /100 | #328 | Tragic $45,094 |
| Yakama | 0.0 /100 | #329 | Tragic $45,002 |
| Immigrants | Mexico | 0.0 /100 | #330 | Tragic $44,960 |
| Natives/Alaskans | 0.0 /100 | #331 | Tragic $44,775 |
| Bahamians | 0.0 /100 | #332 | Tragic $44,756 |
| Immigrants | Congo | 0.0 /100 | #333 | Tragic $44,204 |
| Immigrants | Yemen | 0.0 /100 | #334 | Tragic $44,083 |
| Spanish American Indians | 0.0 /100 | #335 | Tragic $44,010 |
| Immigrants | Cuba | 0.0 /100 | #336 | Tragic $43,461 |
| Menominee | 0.0 /100 | #337 | Tragic $42,581 |
| Crow | 0.0 /100 | #338 | Tragic $42,434 |
Demographics Similar to Immigrants from Costa Rica by Median Male Earnings
In terms of median male earnings, the demographic groups most similar to Immigrants from Costa Rica are Tongan ($53,218, a difference of 0.030%), Immigrants from Kenya ($53,427, a difference of 0.36%), Immigrants from Africa ($53,457, a difference of 0.41%), Immigrants from the Azores ($53,503, a difference of 0.50%), and Immigrants from Thailand ($52,908, a difference of 0.62%).
| Demographics | Rating | Rank | Median Male Earnings |
| Guamanians/Chamorros | 30.7 /100 | #191 | Fair $53,661 |
| Scotch-Irish | 30.6 /100 | #192 | Fair $53,658 |
| Kenyans | 30.4 /100 | #193 | Fair $53,647 |
| Spanish | 29.0 /100 | #194 | Fair $53,576 |
| Immigrants | Azores | 27.5 /100 | #195 | Fair $53,503 |
| Immigrants | Africa | 26.6 /100 | #196 | Fair $53,457 |
| Immigrants | Kenya | 26.0 /100 | #197 | Fair $53,427 |
| Immigrants | Costa Rica | 22.6 /100 | #198 | Fair $53,237 |
| Tongans | 22.3 /100 | #199 | Fair $53,218 |
| Immigrants | Thailand | 17.5 /100 | #200 | Poor $52,908 |
| Immigrants | Bosnia and Herzegovina | 16.9 /100 | #201 | Poor $52,869 |
| Immigrants | Uruguay | 16.8 /100 | #202 | Poor $52,860 |
| Panamanians | 16.5 /100 | #203 | Poor $52,835 |
| Ghanaians | 16.1 /100 | #204 | Poor $52,810 |
| Immigrants | Colombia | 15.0 /100 | #205 | Poor $52,725 |