Immigrants from Mexico vs Immigrants from Hong Kong Median Male Earnings
COMPARE
Immigrants from Mexico
Immigrants from Hong Kong
Median Male Earnings
Median Male Earnings Comparison
Immigrants from Mexico
Immigrants from Hong Kong
$44,960
MEDIAN MALE EARNINGS
0.0/ 100
METRIC RATING
330th/ 347
METRIC RANK
$70,146
MEDIAN MALE EARNINGS
100.0/ 100
METRIC RATING
7th/ 347
METRIC RANK
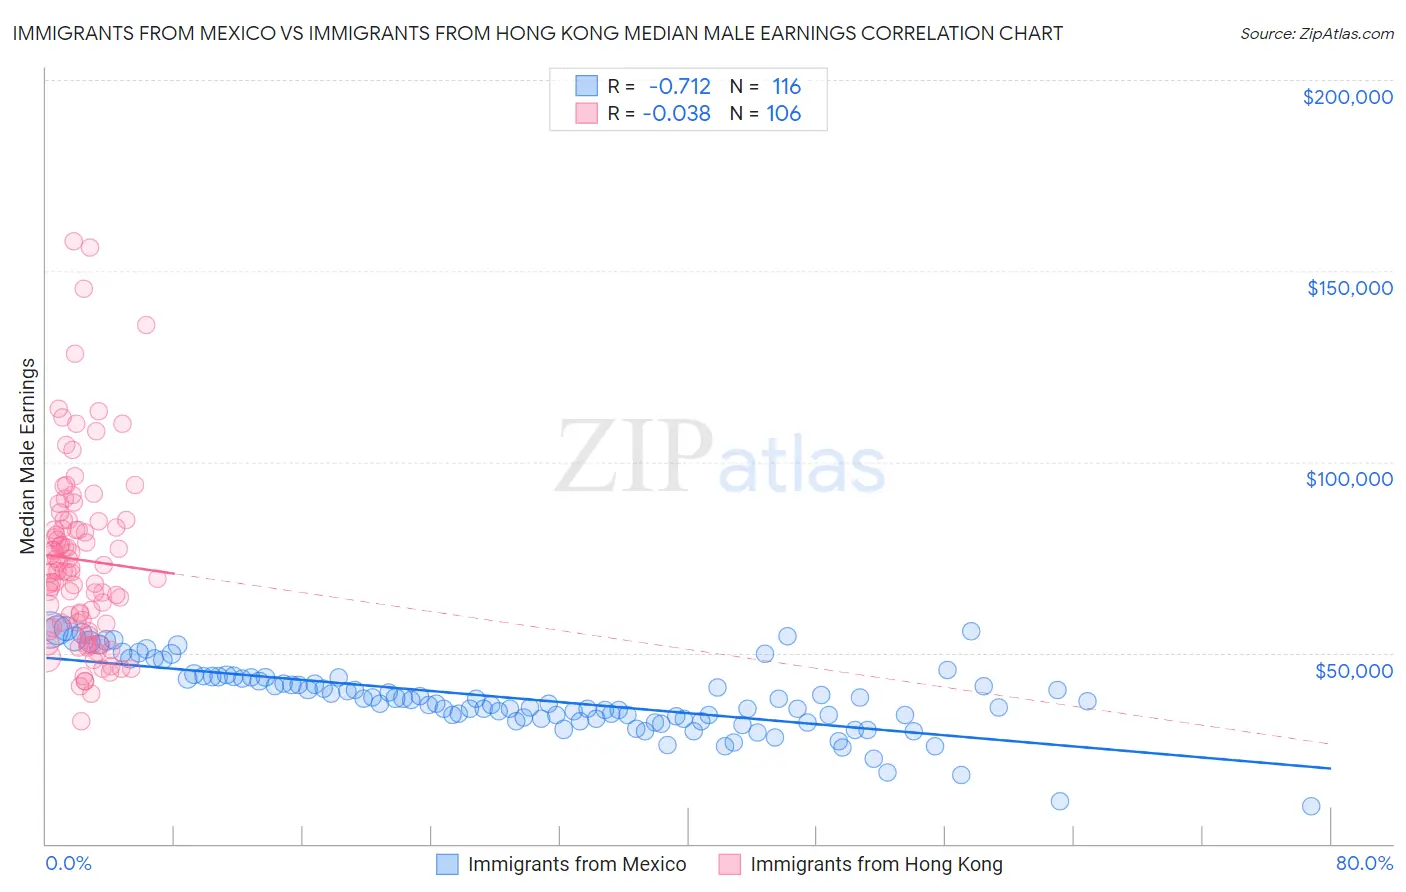
Immigrants from Mexico vs Immigrants from Hong Kong Median Male Earnings Correlation Chart
The statistical analysis conducted on geographies consisting of 513,109,400 people shows a strong negative correlation between the proportion of Immigrants from Mexico and median male earnings in the United States with a correlation coefficient (R) of -0.712 and weighted average of $44,960. Similarly, the statistical analysis conducted on geographies consisting of 253,977,205 people shows no correlation between the proportion of Immigrants from Hong Kong and median male earnings in the United States with a correlation coefficient (R) of -0.038 and weighted average of $70,146, a difference of 56.0%.
Median Male Earnings Correlation Summary
| Measurement | Immigrants from Mexico | Immigrants from Hong Kong |
| Minimum | $9,917 | $31,993 |
| Maximum | $56,239 | $157,888 |
| Range | $46,322 | $125,895 |
| Mean | $37,983 | $74,359 |
| Median | $37,054 | $71,506 |
| Interquartile 25% (IQ1) | $32,850 | $57,587 |
| Interquartile 75% (IQ3) | $43,508 | $84,451 |
| Interquartile Range (IQR) | $10,658 | $26,864 |
| Standard Deviation (Sample) | $9,092 | $24,045 |
| Standard Deviation (Population) | $9,053 | $23,931 |
Similar Demographics by Median Male Earnings
Demographics Similar to Immigrants from Mexico by Median Male Earnings
In terms of median male earnings, the demographic groups most similar to Immigrants from Mexico are Yakama ($45,002, a difference of 0.090%), Kiowa ($45,094, a difference of 0.30%), Native/Alaskan ($44,775, a difference of 0.41%), Bahamian ($44,756, a difference of 0.46%), and Immigrants from Bahamas ($45,176, a difference of 0.48%).
| Demographics | Rating | Rank | Median Male Earnings |
| Immigrants | Central America | 0.0 /100 | #323 | Tragic $45,538 |
| Blacks/African Americans | 0.0 /100 | #324 | Tragic $45,523 |
| Yuman | 0.0 /100 | #325 | Tragic $45,446 |
| Immigrants | Haiti | 0.0 /100 | #326 | Tragic $45,266 |
| Immigrants | Bahamas | 0.0 /100 | #327 | Tragic $45,176 |
| Kiowa | 0.0 /100 | #328 | Tragic $45,094 |
| Yakama | 0.0 /100 | #329 | Tragic $45,002 |
| Immigrants | Mexico | 0.0 /100 | #330 | Tragic $44,960 |
| Natives/Alaskans | 0.0 /100 | #331 | Tragic $44,775 |
| Bahamians | 0.0 /100 | #332 | Tragic $44,756 |
| Immigrants | Congo | 0.0 /100 | #333 | Tragic $44,204 |
| Immigrants | Yemen | 0.0 /100 | #334 | Tragic $44,083 |
| Spanish American Indians | 0.0 /100 | #335 | Tragic $44,010 |
| Immigrants | Cuba | 0.0 /100 | #336 | Tragic $43,461 |
| Menominee | 0.0 /100 | #337 | Tragic $42,581 |
Demographics Similar to Immigrants from Hong Kong by Median Male Earnings
In terms of median male earnings, the demographic groups most similar to Immigrants from Hong Kong are Iranian ($70,648, a difference of 0.72%), Immigrants from Iran ($69,284, a difference of 1.2%), Immigrants from Singapore ($71,348, a difference of 1.7%), Immigrants from South Central Asia ($68,960, a difference of 1.7%), and Immigrants from Israel ($68,716, a difference of 2.1%).
| Demographics | Rating | Rank | Median Male Earnings |
| Filipinos | 100.0 /100 | #1 | Exceptional $74,224 |
| Immigrants | India | 100.0 /100 | #2 | Exceptional $74,207 |
| Immigrants | Taiwan | 100.0 /100 | #3 | Exceptional $74,031 |
| Thais | 100.0 /100 | #4 | Exceptional $72,135 |
| Immigrants | Singapore | 100.0 /100 | #5 | Exceptional $71,348 |
| Iranians | 100.0 /100 | #6 | Exceptional $70,648 |
| Immigrants | Hong Kong | 100.0 /100 | #7 | Exceptional $70,146 |
| Immigrants | Iran | 100.0 /100 | #8 | Exceptional $69,284 |
| Immigrants | South Central Asia | 100.0 /100 | #9 | Exceptional $68,960 |
| Immigrants | Israel | 100.0 /100 | #10 | Exceptional $68,716 |
| Immigrants | Ireland | 100.0 /100 | #11 | Exceptional $67,698 |
| Immigrants | Australia | 100.0 /100 | #12 | Exceptional $67,634 |
| Immigrants | China | 100.0 /100 | #13 | Exceptional $67,353 |
| Okinawans | 100.0 /100 | #14 | Exceptional $67,232 |
| Immigrants | Eastern Asia | 100.0 /100 | #15 | Exceptional $66,903 |