Immigrants from Burma/Myanmar vs Immigrants from Hong Kong Median Male Earnings
COMPARE
Immigrants from Burma/Myanmar
Immigrants from Hong Kong
Median Male Earnings
Median Male Earnings Comparison
Immigrants from Burma/Myanmar
Immigrants from Hong Kong
$50,298
MEDIAN MALE EARNINGS
1.6/ 100
METRIC RATING
249th/ 347
METRIC RANK
$70,146
MEDIAN MALE EARNINGS
100.0/ 100
METRIC RATING
7th/ 347
METRIC RANK
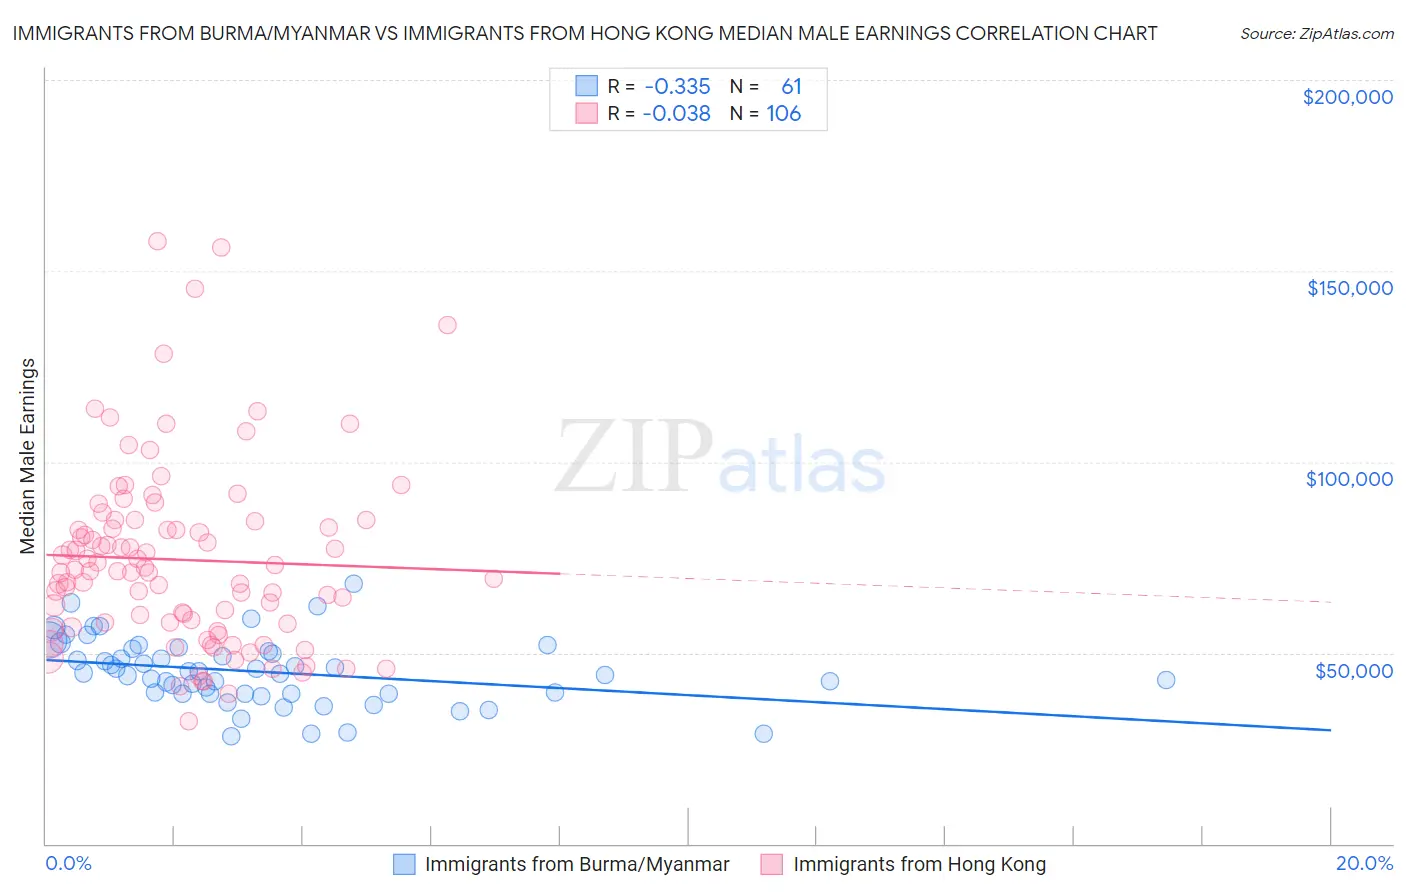
Immigrants from Burma/Myanmar vs Immigrants from Hong Kong Median Male Earnings Correlation Chart
The statistical analysis conducted on geographies consisting of 172,350,242 people shows a mild negative correlation between the proportion of Immigrants from Burma/Myanmar and median male earnings in the United States with a correlation coefficient (R) of -0.335 and weighted average of $50,298. Similarly, the statistical analysis conducted on geographies consisting of 253,977,205 people shows no correlation between the proportion of Immigrants from Hong Kong and median male earnings in the United States with a correlation coefficient (R) of -0.038 and weighted average of $70,146, a difference of 39.5%.
Median Male Earnings Correlation Summary
| Measurement | Immigrants from Burma/Myanmar | Immigrants from Hong Kong |
| Minimum | $27,990 | $31,993 |
| Maximum | $67,960 | $157,888 |
| Range | $39,970 | $125,895 |
| Mean | $45,043 | $74,359 |
| Median | $44,781 | $71,506 |
| Interquartile 25% (IQ1) | $39,264 | $57,587 |
| Interquartile 75% (IQ3) | $50,701 | $84,451 |
| Interquartile Range (IQR) | $11,437 | $26,864 |
| Standard Deviation (Sample) | $8,603 | $24,045 |
| Standard Deviation (Population) | $8,532 | $23,931 |
Similar Demographics by Median Male Earnings
Demographics Similar to Immigrants from Burma/Myanmar by Median Male Earnings
In terms of median male earnings, the demographic groups most similar to Immigrants from Burma/Myanmar are Osage ($50,292, a difference of 0.010%), Immigrants from Grenada ($50,279, a difference of 0.040%), Immigrants from Guyana ($50,321, a difference of 0.050%), Subsaharan African ($50,408, a difference of 0.22%), and Immigrants from Ecuador ($50,474, a difference of 0.35%).
| Demographics | Rating | Rank | Median Male Earnings |
| Guyanese | 2.2 /100 | #242 | Tragic $50,613 |
| French American Indians | 2.2 /100 | #243 | Tragic $50,611 |
| Houma | 2.0 /100 | #244 | Tragic $50,547 |
| Hawaiians | 1.9 /100 | #245 | Tragic $50,488 |
| Immigrants | Ecuador | 1.9 /100 | #246 | Tragic $50,474 |
| Sub-Saharan Africans | 1.8 /100 | #247 | Tragic $50,408 |
| Immigrants | Guyana | 1.6 /100 | #248 | Tragic $50,321 |
| Immigrants | Burma/Myanmar | 1.6 /100 | #249 | Tragic $50,298 |
| Osage | 1.6 /100 | #250 | Tragic $50,292 |
| Immigrants | Grenada | 1.6 /100 | #251 | Tragic $50,279 |
| Immigrants | Cabo Verde | 1.2 /100 | #252 | Tragic $50,009 |
| German Russians | 1.1 /100 | #253 | Tragic $49,924 |
| Senegalese | 1.0 /100 | #254 | Tragic $49,774 |
| Alaskan Athabascans | 0.9 /100 | #255 | Tragic $49,748 |
| Alaska Natives | 0.9 /100 | #256 | Tragic $49,711 |
Demographics Similar to Immigrants from Hong Kong by Median Male Earnings
In terms of median male earnings, the demographic groups most similar to Immigrants from Hong Kong are Iranian ($70,648, a difference of 0.72%), Immigrants from Iran ($69,284, a difference of 1.2%), Immigrants from Singapore ($71,348, a difference of 1.7%), Immigrants from South Central Asia ($68,960, a difference of 1.7%), and Immigrants from Israel ($68,716, a difference of 2.1%).
| Demographics | Rating | Rank | Median Male Earnings |
| Filipinos | 100.0 /100 | #1 | Exceptional $74,224 |
| Immigrants | India | 100.0 /100 | #2 | Exceptional $74,207 |
| Immigrants | Taiwan | 100.0 /100 | #3 | Exceptional $74,031 |
| Thais | 100.0 /100 | #4 | Exceptional $72,135 |
| Immigrants | Singapore | 100.0 /100 | #5 | Exceptional $71,348 |
| Iranians | 100.0 /100 | #6 | Exceptional $70,648 |
| Immigrants | Hong Kong | 100.0 /100 | #7 | Exceptional $70,146 |
| Immigrants | Iran | 100.0 /100 | #8 | Exceptional $69,284 |
| Immigrants | South Central Asia | 100.0 /100 | #9 | Exceptional $68,960 |
| Immigrants | Israel | 100.0 /100 | #10 | Exceptional $68,716 |
| Immigrants | Ireland | 100.0 /100 | #11 | Exceptional $67,698 |
| Immigrants | Australia | 100.0 /100 | #12 | Exceptional $67,634 |
| Immigrants | China | 100.0 /100 | #13 | Exceptional $67,353 |
| Okinawans | 100.0 /100 | #14 | Exceptional $67,232 |
| Immigrants | Eastern Asia | 100.0 /100 | #15 | Exceptional $66,903 |