Immigrants from Kenya vs Immigrants from England Wage/Income Gap

COMPARE

Immigrants from Kenya
Race
Ancestry
AfghanAfricanAlaska NativeAlaskan AthabascanAlbanianAleutAlsatianAmericanApacheArabArapahoArgentineanArmenianAssyrian/Chaldean/SyriacAustralianAustrianBahamianBangladeshiBarbadianBasqueBelgianBelizeanBermudanBhutaneseBlackfeetBolivianBrazilianBritishBritish West IndianBulgarianBurmeseCajunCambodianCanadianCape VerdeanCarpatho RusynCelticCentral AmericanCentral American IndianCherokeeCheyenneChickasawChileanChineseChippewaChoctawColombianColvilleComancheCosta RicanCreeCreekCroatianCrowCubanCypriotCzechCzechoslovakianDanishDelawareDominicanDutchDutch West IndianEastern EuropeanEcuadorianEgyptianEnglishEstonianEthiopianEuropeanFijianFilipinoFinnishFrenchFrench American IndianFrench CanadianGermanGerman RussianGhanaianGreekGuamanian/ChamorroGuatemalanGuyaneseHaitianHmongHonduranHopiHoumaHungarianIcelanderIndian (Asian)IndonesianInupiatIranianIraqiIrishIroquoisIsraeliItalianJamaicanJapaneseJordanianKenyanKiowaKoreanLaotianLatvianLebaneseLiberianLithuanianLumbeeLuxembourgerMacedonianMalaysianMalteseMarshalleseMenomineeMexicanMexican American IndianMongolianMoroccanNative HawaiianNavajoNepaleseNew ZealanderNicaraguanNigerianNorthern EuropeanNorwegianOkinawanOsageOttawaPaiutePakistaniPalestinianPanamanianParaguayanPennsylvania GermanPeruvianPimaPolishPortuguesePotawatomiPuebloPuerto RicanPuget Sound SalishRomanianRussianSalvadoranSamoanScandinavianScotch-IrishScottishSeminoleSenegaleseSerbianShoshoneSierra LeoneanSiouxSlavicSlovakSloveneSomaliSouth AfricanSouth AmericanSouth American IndianSoviet UnionSpaniardSpanishSpanish AmericanSpanish American IndianSri LankanSubsaharan AfricanSudaneseSwedishSwissSyrianTaiwaneseThaiTlingit-HaidaTohono O'OdhamTonganTrinidadian and TobagonianTsimshianTurkishU.S. Virgin IslanderUgandanUkrainianUruguayanUteVenezuelanVietnameseWelshWest IndianYakamaYaquiYugoslavianYumanYup'ikZimbabwean
Immigration
NonimmigrantsImmigrantsAfghanistanAfricaAlbaniaArgentinaArmeniaAsiaAustraliaAustriaBahamasBangladeshBarbadosBelarusBelgiumBelizeBoliviaBosnia and HerzegovinaBrazilBulgariaBurma/MyanmarCabo VerdeCambodiaCameroonCanadaCaribbeanCentral AmericaChileChinaColombiaCongoCosta RicaCroatiaCubaCzechoslovakiaDenmarkDominicaDominican RepublicEastern AfricaEastern AsiaEastern EuropeEcuadorEgyptEl SalvadorEritreaEthiopiaEuropeFijiFranceGermanyGhanaGreeceGrenadaGuatemalaGuyanaHaitiHondurasHong KongHungaryIndiaIndonesiaIranIraqIrelandIsraelItalyJamaicaJapanJordanKazakhstanKenyaKoreaKuwaitLaosLatin AmericaLatviaLebanonLiberiaLithuaniaMalaysiaMexicoMicronesiaMiddle AfricaMoldovaMoroccoNepalNetherlandsNicaraguaNigeriaNorth AmericaNorth MacedoniaNorthern AfricaNorthern EuropeNorwayOceaniaPakistanPanamaPeruPhilippinesPolandPortugalRomaniaRussiaSaudi ArabiaScotlandSenegalSerbiaSierra LeoneSingaporeSomaliaSouth AfricaSouth AmericaSouth Central AsiaSouth Eastern AsiaSouthern EuropeSpainSri LankaSt. Vincent and the GrenadinesSudanSwedenSwitzerlandSyriaTaiwanThailandTrinidad and TobagoTurkeyUgandaUkraineUruguayUzbekistanVenezuelaVietnamWest IndiesWestern AfricaWestern AsiaWestern EuropeYemenZaireZimbabweAzores
Immigrants from England
Race
Ancestry
AfghanAfricanAlaska NativeAlaskan AthabascanAlbanianAleutAlsatianAmericanApacheArabArapahoArgentineanArmenianAssyrian/Chaldean/SyriacAustralianAustrianBahamianBangladeshiBarbadianBasqueBelgianBelizeanBermudanBhutaneseBlackfeetBolivianBrazilianBritishBritish West IndianBulgarianBurmeseCajunCambodianCanadianCape VerdeanCarpatho RusynCelticCentral AmericanCentral American IndianCherokeeCheyenneChickasawChileanChineseChippewaChoctawColombianColvilleComancheCosta RicanCreeCreekCroatianCrowCubanCypriotCzechCzechoslovakianDanishDelawareDominicanDutchDutch West IndianEastern EuropeanEcuadorianEgyptianEnglishEstonianEthiopianEuropeanFijianFilipinoFinnishFrenchFrench American IndianFrench CanadianGermanGerman RussianGhanaianGreekGuamanian/ChamorroGuatemalanGuyaneseHaitianHmongHonduranHopiHoumaHungarianIcelanderIndian (Asian)IndonesianInupiatIranianIraqiIrishIroquoisIsraeliItalianJamaicanJapaneseJordanianKenyanKiowaKoreanLaotianLatvianLebaneseLiberianLithuanianLumbeeLuxembourgerMacedonianMalaysianMalteseMarshalleseMenomineeMexicanMexican American IndianMongolianMoroccanNative HawaiianNavajoNepaleseNew ZealanderNicaraguanNigerianNorthern EuropeanNorwegianOkinawanOsageOttawaPaiutePakistaniPalestinianPanamanianParaguayanPennsylvania GermanPeruvianPimaPolishPortuguesePotawatomiPuebloPuerto RicanPuget Sound SalishRomanianRussianSalvadoranSamoanScandinavianScotch-IrishScottishSeminoleSenegaleseSerbianShoshoneSierra LeoneanSiouxSlavicSlovakSloveneSomaliSouth AfricanSouth AmericanSouth American IndianSoviet UnionSpaniardSpanishSpanish AmericanSpanish American IndianSri LankanSubsaharan AfricanSudaneseSwedishSwissSyrianTaiwaneseThaiTlingit-HaidaTohono O'OdhamTonganTrinidadian and TobagonianTsimshianTurkishU.S. Virgin IslanderUgandanUkrainianUruguayanUteVenezuelanVietnameseWelshWest IndianYakamaYaquiYugoslavianYumanYup'ikZimbabwean
Immigration
NonimmigrantsImmigrantsAfghanistanAfricaAlbaniaArgentinaArmeniaAsiaAustraliaAustriaBahamasBangladeshBarbadosBelarusBelgiumBelizeBoliviaBosnia and HerzegovinaBrazilBulgariaBurma/MyanmarCabo VerdeCambodiaCameroonCanadaCaribbeanCentral AmericaChileChinaColombiaCongoCosta RicaCroatiaCubaCzechoslovakiaDenmarkDominicaDominican RepublicEastern AfricaEastern AsiaEastern EuropeEcuadorEgyptEl SalvadorEnglandEritreaEthiopiaEuropeFijiFranceGermanyGhanaGreeceGrenadaGuatemalaGuyanaHaitiHondurasHong KongHungaryIndiaIndonesiaIranIraqIrelandIsraelItalyJamaicaJapanJordanKazakhstanKoreaKuwaitLaosLatin AmericaLatviaLebanonLiberiaLithuaniaMalaysiaMexicoMicronesiaMiddle AfricaMoldovaMoroccoNepalNetherlandsNicaraguaNigeriaNorth AmericaNorth MacedoniaNorthern AfricaNorthern EuropeNorwayOceaniaPakistanPanamaPeruPhilippinesPolandPortugalRomaniaRussiaSaudi ArabiaScotlandSenegalSerbiaSierra LeoneSingaporeSomaliaSouth AfricaSouth AmericaSouth Central AsiaSouth Eastern AsiaSouthern EuropeSpainSri LankaSt. Vincent and the GrenadinesSudanSwedenSwitzerlandSyriaTaiwanThailandTrinidad and TobagoTurkeyUgandaUkraineUruguayUzbekistanVenezuelaVietnamWest IndiesWestern AfricaWestern AsiaWestern EuropeYemenZaireZimbabweAzores
Wage/Income Gap
Income
Poverty
Unemployment
Labor Participation
Family Structure
Vehicle Availability
Education Level
Disability

Wage/Income Gap Comparison

Immigrants from Kenya

Immigrants from England

Exceptional
Tragic
24.4%
WAGE/INCOME GAP
96.4/ 100
METRIC RATING
115th/ 347
METRIC RANK
27.9%
WAGE/INCOME GAP
0.6/ 100
METRIC RATING
278th/ 347
METRIC RANK

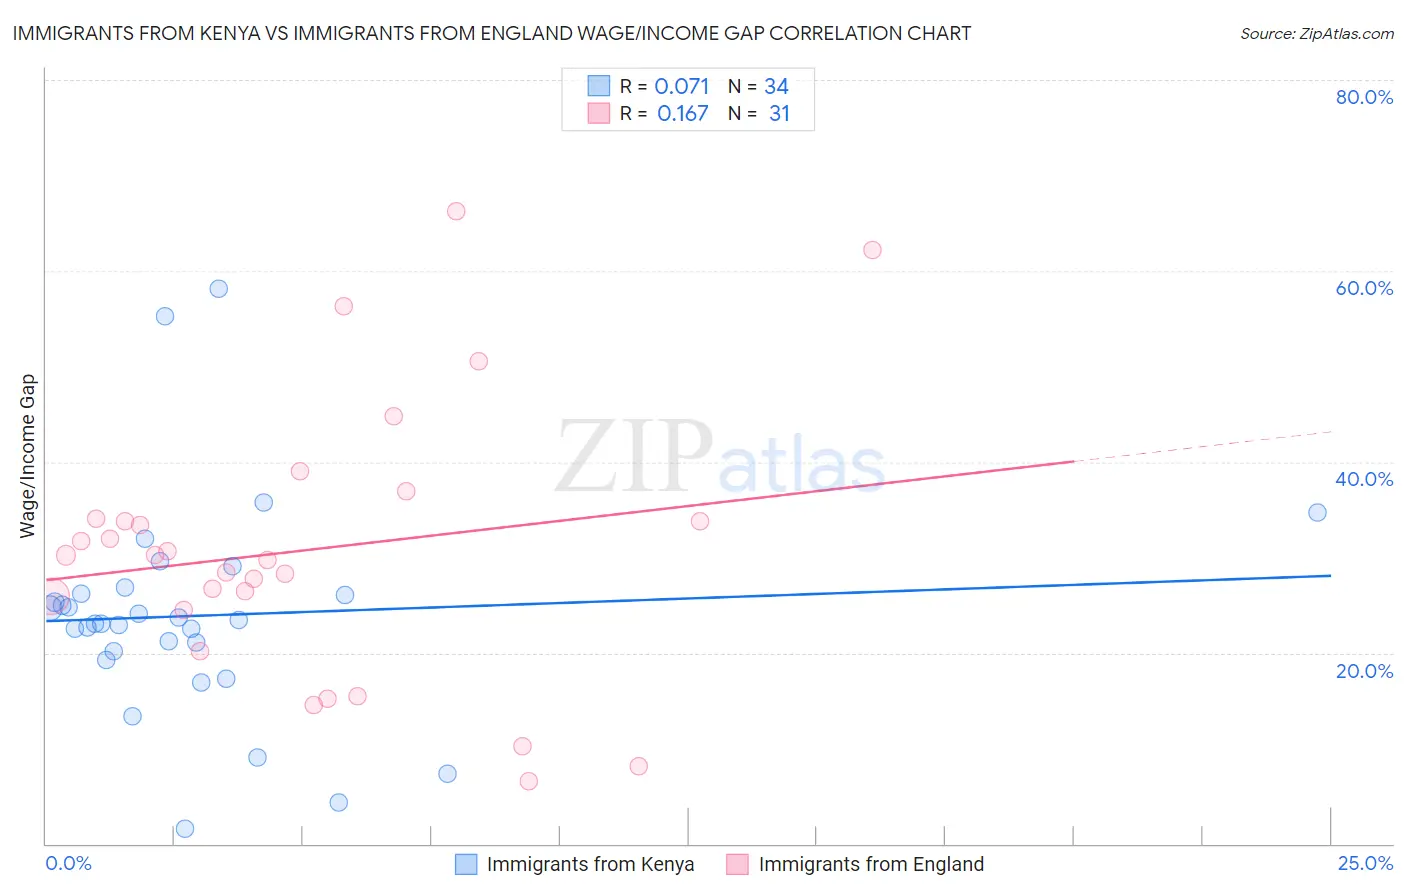
Immigrants from Kenya vs Immigrants from England Wage/Income Gap Correlation Chart

The statistical analysis conducted on geographies consisting of 218,055,020 people shows a slight positive correlation between the proportion of Immigrants from Kenya and wage/income gap percentage in the United States with a correlation coefficient (R) of 0.071 and weighted average of 24.4%. Similarly, the statistical analysis conducted on geographies consisting of 391,474,935 people shows a poor positive correlation between the proportion of Immigrants from England and wage/income gap percentage in the United States with a correlation coefficient (R) of 0.167 and weighted average of 27.9%, a difference of 14.4%.
Immigrants from Kenya vs Immigrants from England Wage/Income Gap

Wage/Income Gap Correlation Summary

MeasurementImmigrants from KenyaImmigrants from England
Minimum1.6%6.6%
Maximum58.2%66.3%
Range56.5%59.7%
Mean23.9%30.8%
Median23.2%30.2%
Interquartile 25% (IQ1)20.1%24.5%
Interquartile 75% (IQ3)26.2%34.1%
Interquartile Range (IQR)6.1%9.6%
Standard Deviation (Sample)11.3%14.3%
Standard Deviation (Population)11.1%14.0%

Similar Demographics by Wage/Income Gap

Demographics Similar to Immigrants from Kenya by Wage/Income Gap

In terms of wage/income gap, the demographic groups most similar to Immigrants from Kenya are Panamanian (24.4%, a difference of 0.060%), Alaska Native (24.4%, a difference of 0.17%), Immigrants from Afghanistan (24.4%, a difference of 0.23%), Sioux (24.3%, a difference of 0.26%), and Immigrants from Micronesia (24.4%, a difference of 0.26%).
DemographicsRating | RankWage/Income Gap
Immigrants | Albania
98.4
/100
|
#108
Exceptional
24.0%
Ugandans
98.3
/100
|
#109
Exceptional
24.1%
Immigrants | Morocco
98.1
/100
|
#110
Exceptional
24.1%
Soviet Union
97.6
/100
|
#111
Exceptional
24.2%
Immigrants | Colombia
97.0
/100
|
#112
Exceptional
24.3%
Sioux
96.9
/100
|
#113
Exceptional
24.3%
Panamanians
96.5
/100
|
#114
Exceptional
24.4%
Immigrants | Kenya
96.4
/100
|
#115
Exceptional
24.4%
Alaska Natives
96.0
/100
|
#116
Exceptional
24.4%
Immigrants | Afghanistan
95.9
/100
|
#117
Exceptional
24.4%
Immigrants | Micronesia
95.8
/100
|
#118
Exceptional
24.4%
Kenyans
95.8
/100
|
#119
Exceptional
24.5%
Cree
95.6
/100
|
#120
Exceptional
24.5%
Immigrants | Thailand
94.9
/100
|
#121
Exceptional
24.5%
Apache
94.8
/100
|
#122
Exceptional
24.5%

Demographics Similar to Immigrants from England by Wage/Income Gap

In terms of wage/income gap, the demographic groups most similar to Immigrants from England are Lebanese (27.9%, a difference of 0.080%), Latvian (27.9%, a difference of 0.080%), Immigrants from Japan (27.9%, a difference of 0.11%), American (27.8%, a difference of 0.19%), and Bulgarian (27.8%, a difference of 0.23%).
DemographicsRating | RankWage/Income Gap
Ute
0.8
/100
|
#271
Tragic
27.8%
Immigrants | Korea
0.8
/100
|
#272
Tragic
27.8%
Bulgarians
0.7
/100
|
#273
Tragic
27.8%
Americans
0.7
/100
|
#274
Tragic
27.8%
Immigrants | Japan
0.7
/100
|
#275
Tragic
27.9%
Lebanese
0.7
/100
|
#276
Tragic
27.9%
Latvians
0.7
/100
|
#277
Tragic
27.9%
Immigrants | England
0.6
/100
|
#278
Tragic
27.9%
Romanians
0.5
/100
|
#279
Tragic
28.0%
Russians
0.5
/100
|
#280
Tragic
28.0%
Burmese
0.5
/100
|
#281
Tragic
28.0%
South Africans
0.5
/100
|
#282
Tragic
28.0%
French Canadians
0.4
/100
|
#283
Tragic
28.1%
Immigrants | Sweden
0.4
/100
|
#284
Tragic
28.1%
Italians
0.4
/100
|
#285
Tragic
28.1%