Moroccan vs Immigrants from Ecuador Wage/Income Gap
COMPARE
Moroccan
Immigrants from Ecuador
Wage/Income Gap
Wage/Income Gap Comparison
Moroccans
Immigrants from Ecuador
24.0%
WAGE/INCOME GAP
98.6/ 100
METRIC RATING
105th/ 347
METRIC RANK
22.5%
WAGE/INCOME GAP
100.0/ 100
METRIC RATING
63rd/ 347
METRIC RANK
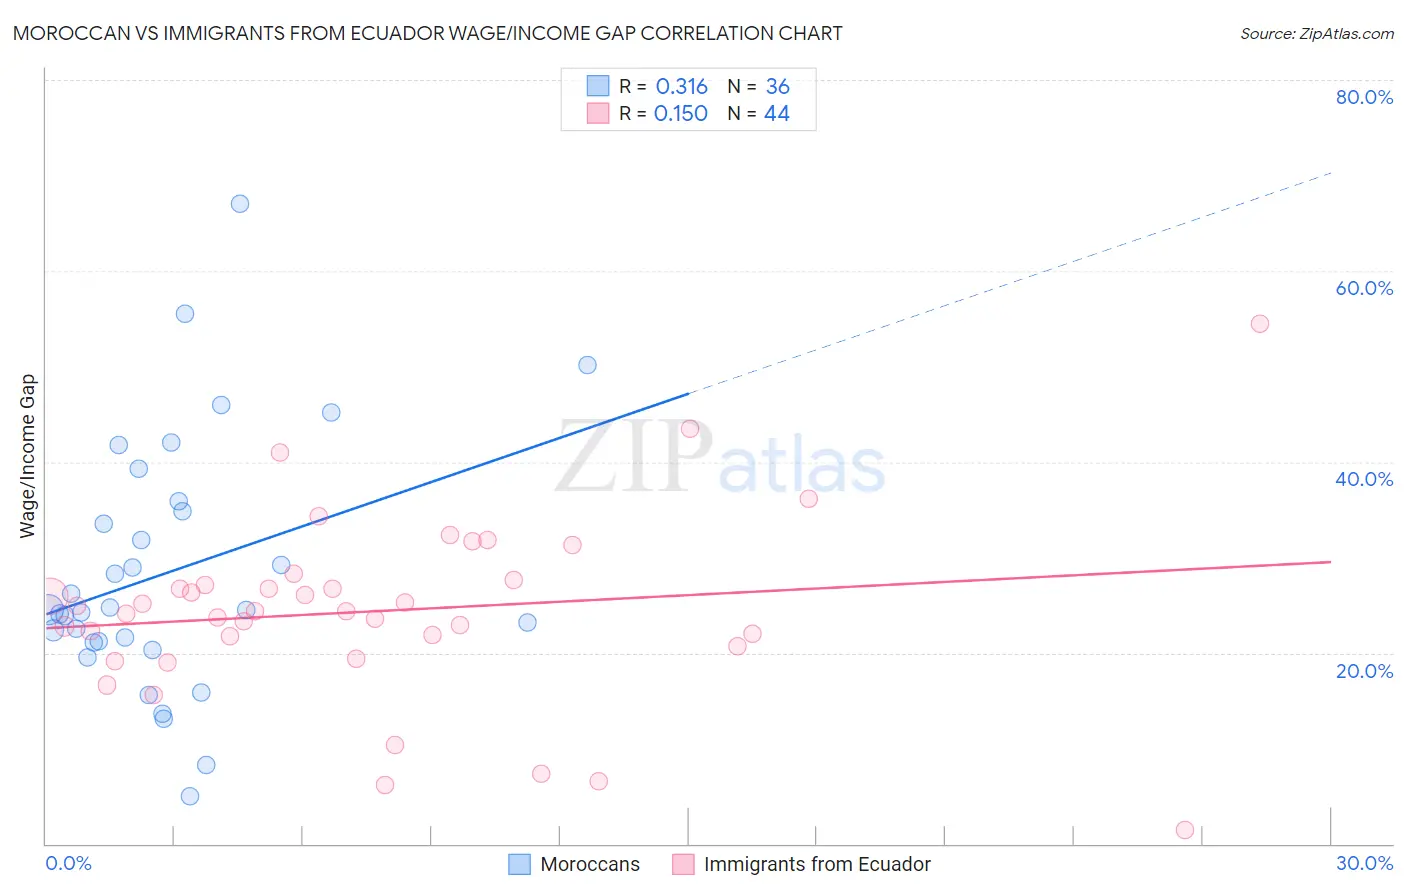
Moroccan vs Immigrants from Ecuador Wage/Income Gap Correlation Chart
The statistical analysis conducted on geographies consisting of 201,754,840 people shows a mild positive correlation between the proportion of Moroccans and wage/income gap percentage in the United States with a correlation coefficient (R) of 0.316 and weighted average of 24.0%. Similarly, the statistical analysis conducted on geographies consisting of 270,894,682 people shows a poor positive correlation between the proportion of Immigrants from Ecuador and wage/income gap percentage in the United States with a correlation coefficient (R) of 0.150 and weighted average of 22.5%, a difference of 6.6%.
Wage/Income Gap Correlation Summary
| Measurement | Moroccan | Immigrants from Ecuador |
| Minimum | 4.9% | 1.4% |
| Maximum | 67.0% | 54.5% |
| Range | 62.1% | 53.1% |
| Mean | 28.5% | 24.4% |
| Median | 24.5% | 24.4% |
| Interquartile 25% (IQ1) | 21.2% | 21.2% |
| Interquartile 75% (IQ3) | 35.4% | 27.3% |
| Interquartile Range (IQR) | 14.2% | 6.1% |
| Standard Deviation (Sample) | 13.2% | 9.6% |
| Standard Deviation (Population) | 13.1% | 9.5% |
Similar Demographics by Wage/Income Gap
Demographics Similar to Moroccans by Wage/Income Gap
In terms of wage/income gap, the demographic groups most similar to Moroccans are Sudanese (24.0%, a difference of 0.0%), Tlingit-Haida (24.0%, a difference of 0.060%), Yaqui (24.0%, a difference of 0.31%), Immigrants from Albania (24.0%, a difference of 0.31%), and Ugandan (24.1%, a difference of 0.37%).
| Demographics | Rating | Rank | Wage/Income Gap |
| Immigrants | Latin America | 99.2 /100 | #98 | Exceptional 23.7% |
| Aleuts | 99.2 /100 | #99 | Exceptional 23.7% |
| Yakama | 99.2 /100 | #100 | Exceptional 23.7% |
| Japanese | 99.1 /100 | #101 | Exceptional 23.8% |
| Immigrants | Laos | 99.0 /100 | #102 | Exceptional 23.8% |
| Tsimshian | 98.9 /100 | #103 | Exceptional 23.9% |
| Tlingit-Haida | 98.7 /100 | #104 | Exceptional 24.0% |
| Moroccans | 98.6 /100 | #105 | Exceptional 24.0% |
| Sudanese | 98.6 /100 | #106 | Exceptional 24.0% |
| Yaqui | 98.4 /100 | #107 | Exceptional 24.0% |
| Immigrants | Albania | 98.4 /100 | #108 | Exceptional 24.0% |
| Ugandans | 98.3 /100 | #109 | Exceptional 24.1% |
| Immigrants | Morocco | 98.1 /100 | #110 | Exceptional 24.1% |
| Soviet Union | 97.6 /100 | #111 | Exceptional 24.2% |
| Immigrants | Colombia | 97.0 /100 | #112 | Exceptional 24.3% |
Demographics Similar to Immigrants from Ecuador by Wage/Income Gap
In terms of wage/income gap, the demographic groups most similar to Immigrants from Ecuador are Immigrants from Guatemala (22.5%, a difference of 0.14%), Spanish American Indian (22.5%, a difference of 0.29%), Immigrants from Fiji (22.4%, a difference of 0.35%), Immigrants from Middle Africa (22.4%, a difference of 0.52%), and Navajo (22.4%, a difference of 0.54%).
| Demographics | Rating | Rank | Wage/Income Gap |
| Immigrants | Ghana | 100.0 /100 | #56 | Exceptional 22.3% |
| Ghanaians | 100.0 /100 | #57 | Exceptional 22.3% |
| Immigrants | Cuba | 100.0 /100 | #58 | Exceptional 22.4% |
| Navajo | 100.0 /100 | #59 | Exceptional 22.4% |
| Immigrants | Middle Africa | 100.0 /100 | #60 | Exceptional 22.4% |
| Immigrants | Fiji | 100.0 /100 | #61 | Exceptional 22.4% |
| Immigrants | Guatemala | 100.0 /100 | #62 | Exceptional 22.5% |
| Immigrants | Ecuador | 100.0 /100 | #63 | Exceptional 22.5% |
| Spanish American Indians | 100.0 /100 | #64 | Exceptional 22.5% |
| Guatemalans | 99.9 /100 | #65 | Exceptional 22.6% |
| Central American Indians | 99.9 /100 | #66 | Exceptional 22.7% |
| Menominee | 99.9 /100 | #67 | Exceptional 22.7% |
| Immigrants | Nigeria | 99.9 /100 | #68 | Exceptional 22.7% |
| Indonesians | 99.9 /100 | #69 | Exceptional 22.7% |
| Immigrants | Uzbekistan | 99.9 /100 | #70 | Exceptional 22.7% |