Macedonian vs Immigrants from Ecuador Wage/Income Gap
COMPARE
Macedonian
Immigrants from Ecuador
Wage/Income Gap
Wage/Income Gap Comparison
Macedonians
Immigrants from Ecuador
28.6%
WAGE/INCOME GAP
0.1/ 100
METRIC RATING
309th/ 347
METRIC RANK
22.5%
WAGE/INCOME GAP
100.0/ 100
METRIC RATING
63rd/ 347
METRIC RANK
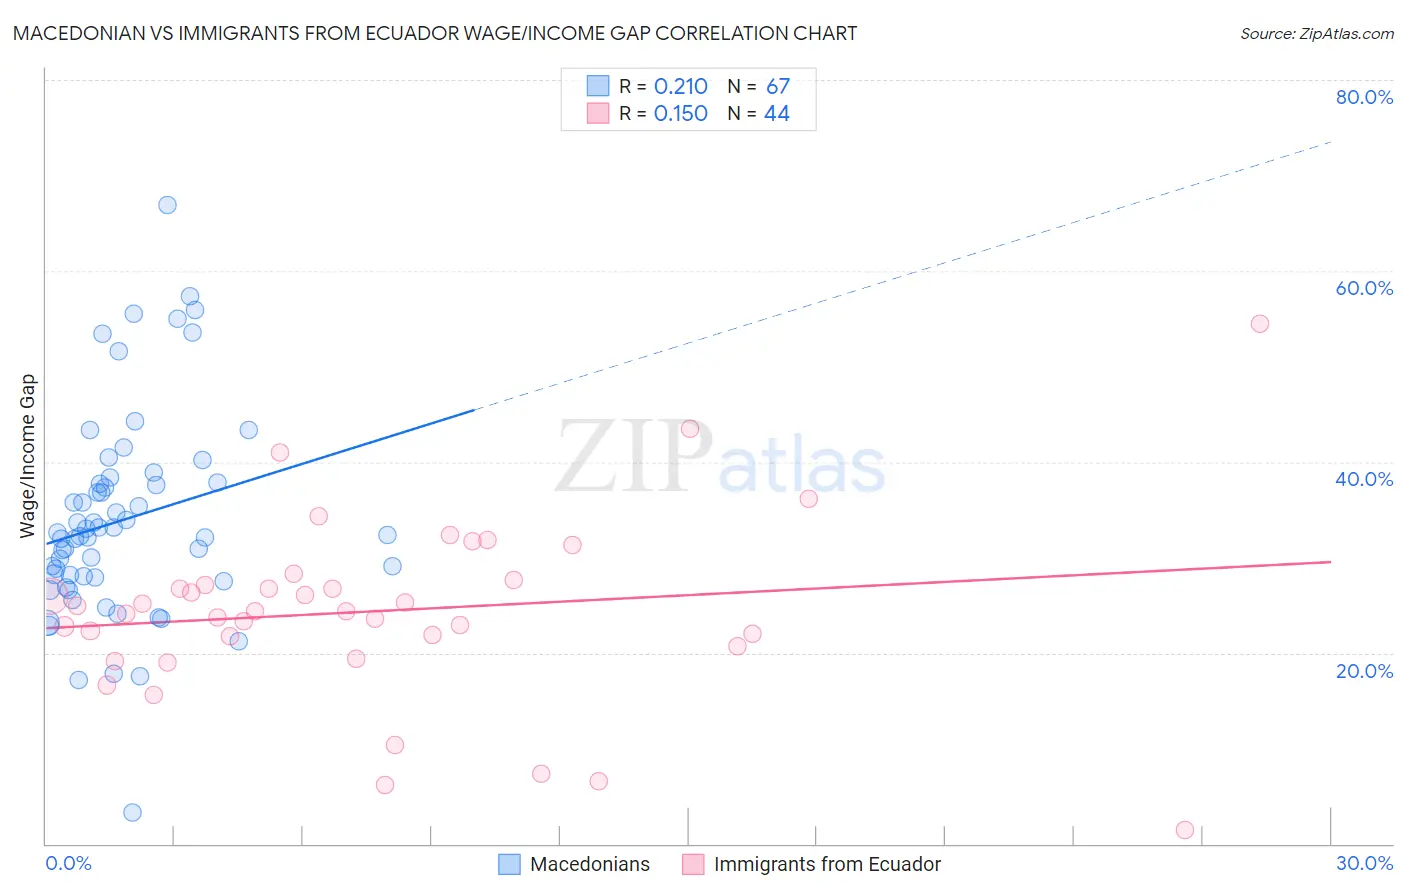
Macedonian vs Immigrants from Ecuador Wage/Income Gap Correlation Chart
The statistical analysis conducted on geographies consisting of 132,645,129 people shows a weak positive correlation between the proportion of Macedonians and wage/income gap percentage in the United States with a correlation coefficient (R) of 0.210 and weighted average of 28.6%. Similarly, the statistical analysis conducted on geographies consisting of 270,894,682 people shows a poor positive correlation between the proportion of Immigrants from Ecuador and wage/income gap percentage in the United States with a correlation coefficient (R) of 0.150 and weighted average of 22.5%, a difference of 27.1%.
Wage/Income Gap Correlation Summary
| Measurement | Macedonian | Immigrants from Ecuador |
| Minimum | 3.2% | 1.4% |
| Maximum | 67.0% | 54.5% |
| Range | 63.7% | 53.1% |
| Mean | 33.9% | 24.4% |
| Median | 32.4% | 24.4% |
| Interquartile 25% (IQ1) | 27.9% | 21.2% |
| Interquartile 75% (IQ3) | 37.9% | 27.3% |
| Interquartile Range (IQR) | 10.0% | 6.1% |
| Standard Deviation (Sample) | 10.8% | 9.6% |
| Standard Deviation (Population) | 10.8% | 9.5% |
Similar Demographics by Wage/Income Gap
Demographics Similar to Macedonians by Wage/Income Gap
In terms of wage/income gap, the demographic groups most similar to Macedonians are Polish (28.5%, a difference of 0.090%), Finnish (28.6%, a difference of 0.090%), Immigrants from Denmark (28.5%, a difference of 0.16%), Immigrants from Lithuania (28.6%, a difference of 0.16%), and White/Caucasian (28.5%, a difference of 0.17%).
| Demographics | Rating | Rank | Wage/Income Gap |
| Scotch-Irish | 0.2 /100 | #302 | Tragic 28.5% |
| Irish | 0.2 /100 | #303 | Tragic 28.5% |
| Immigrants | Netherlands | 0.2 /100 | #304 | Tragic 28.5% |
| Immigrants | South Africa | 0.1 /100 | #305 | Tragic 28.5% |
| Whites/Caucasians | 0.1 /100 | #306 | Tragic 28.5% |
| Immigrants | Denmark | 0.1 /100 | #307 | Tragic 28.5% |
| Poles | 0.1 /100 | #308 | Tragic 28.5% |
| Macedonians | 0.1 /100 | #309 | Tragic 28.6% |
| Finns | 0.1 /100 | #310 | Tragic 28.6% |
| Immigrants | Lithuania | 0.1 /100 | #311 | Tragic 28.6% |
| Eastern Europeans | 0.1 /100 | #312 | Tragic 28.6% |
| French | 0.1 /100 | #313 | Tragic 28.7% |
| Immigrants | Scotland | 0.1 /100 | #314 | Tragic 28.7% |
| Maltese | 0.1 /100 | #315 | Tragic 28.7% |
| Lithuanians | 0.1 /100 | #316 | Tragic 28.7% |
Demographics Similar to Immigrants from Ecuador by Wage/Income Gap
In terms of wage/income gap, the demographic groups most similar to Immigrants from Ecuador are Immigrants from Guatemala (22.5%, a difference of 0.14%), Spanish American Indian (22.5%, a difference of 0.29%), Immigrants from Fiji (22.4%, a difference of 0.35%), Immigrants from Middle Africa (22.4%, a difference of 0.52%), and Navajo (22.4%, a difference of 0.54%).
| Demographics | Rating | Rank | Wage/Income Gap |
| Immigrants | Ghana | 100.0 /100 | #56 | Exceptional 22.3% |
| Ghanaians | 100.0 /100 | #57 | Exceptional 22.3% |
| Immigrants | Cuba | 100.0 /100 | #58 | Exceptional 22.4% |
| Navajo | 100.0 /100 | #59 | Exceptional 22.4% |
| Immigrants | Middle Africa | 100.0 /100 | #60 | Exceptional 22.4% |
| Immigrants | Fiji | 100.0 /100 | #61 | Exceptional 22.4% |
| Immigrants | Guatemala | 100.0 /100 | #62 | Exceptional 22.5% |
| Immigrants | Ecuador | 100.0 /100 | #63 | Exceptional 22.5% |
| Spanish American Indians | 100.0 /100 | #64 | Exceptional 22.5% |
| Guatemalans | 99.9 /100 | #65 | Exceptional 22.6% |
| Central American Indians | 99.9 /100 | #66 | Exceptional 22.7% |
| Menominee | 99.9 /100 | #67 | Exceptional 22.7% |
| Immigrants | Nigeria | 99.9 /100 | #68 | Exceptional 22.7% |
| Indonesians | 99.9 /100 | #69 | Exceptional 22.7% |
| Immigrants | Uzbekistan | 99.9 /100 | #70 | Exceptional 22.7% |