Moroccan vs Immigrants from Ecuador 3rd Grade
COMPARE
Moroccan
Immigrants from Ecuador
3rd Grade
3rd Grade Comparison
Moroccans
Immigrants from Ecuador
97.6%
3RD GRADE
8.5/ 100
METRIC RATING
213th/ 347
METRIC RANK
96.6%
3RD GRADE
0.0/ 100
METRIC RATING
313th/ 347
METRIC RANK
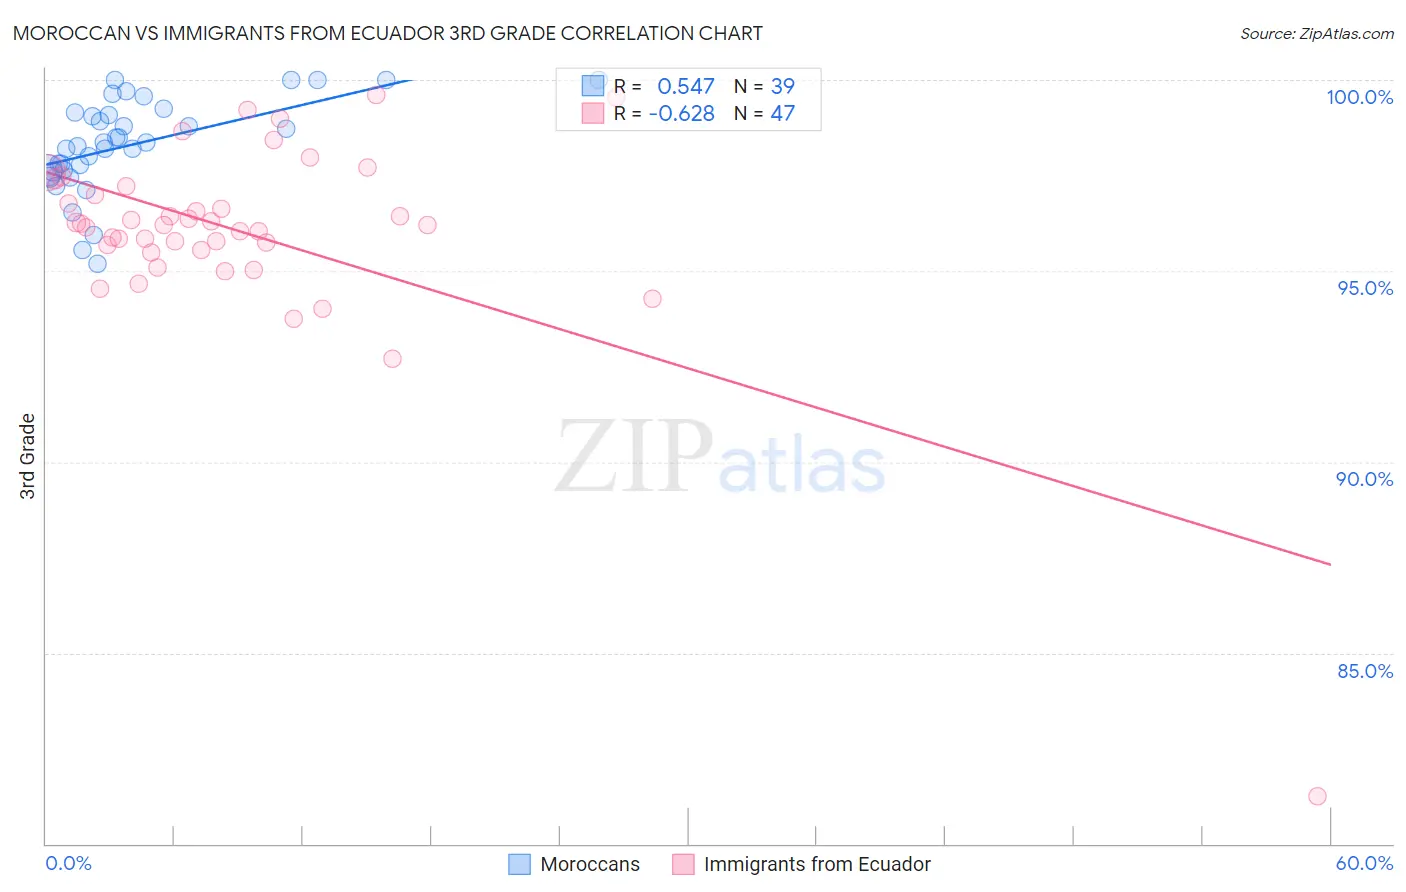
Moroccan vs Immigrants from Ecuador 3rd Grade Correlation Chart
The statistical analysis conducted on geographies consisting of 201,817,667 people shows a substantial positive correlation between the proportion of Moroccans and percentage of population with at least 3rd grade education in the United States with a correlation coefficient (R) of 0.547 and weighted average of 97.6%. Similarly, the statistical analysis conducted on geographies consisting of 271,020,679 people shows a significant negative correlation between the proportion of Immigrants from Ecuador and percentage of population with at least 3rd grade education in the United States with a correlation coefficient (R) of -0.628 and weighted average of 96.6%, a difference of 1.0%.
3rd Grade Correlation Summary
| Measurement | Moroccan | Immigrants from Ecuador |
| Minimum | 95.2% | 81.2% |
| Maximum | 100.0% | 99.6% |
| Range | 4.8% | 18.3% |
| Mean | 98.3% | 96.0% |
| Median | 98.3% | 96.2% |
| Interquartile 25% (IQ1) | 97.6% | 95.5% |
| Interquartile 75% (IQ3) | 99.1% | 97.2% |
| Interquartile Range (IQR) | 1.5% | 1.7% |
| Standard Deviation (Sample) | 1.2% | 2.7% |
| Standard Deviation (Population) | 1.2% | 2.6% |
Similar Demographics by 3rd Grade
Demographics Similar to Moroccans by 3rd Grade
In terms of 3rd grade, the demographic groups most similar to Moroccans are Immigrants from Bahamas (97.6%, a difference of 0.0%), Yuman (97.6%, a difference of 0.0%), Costa Rican (97.6%, a difference of 0.010%), Immigrants from Oceania (97.6%, a difference of 0.010%), and Laotian (97.6%, a difference of 0.010%).
| Demographics | Rating | Rank | 3rd Grade |
| Immigrants | Northern Africa | 13.0 /100 | #206 | Poor 97.6% |
| Tohono O'odham | 12.5 /100 | #207 | Poor 97.6% |
| Immigrants | Zaire | 11.9 /100 | #208 | Poor 97.6% |
| Costa Ricans | 9.6 /100 | #209 | Tragic 97.6% |
| Immigrants | Oceania | 9.5 /100 | #210 | Tragic 97.6% |
| Laotians | 9.4 /100 | #211 | Tragic 97.6% |
| Immigrants | Bahamas | 8.5 /100 | #212 | Tragic 97.6% |
| Moroccans | 8.5 /100 | #213 | Tragic 97.6% |
| Yuman | 8.4 /100 | #214 | Tragic 97.6% |
| Iraqis | 6.9 /100 | #215 | Tragic 97.5% |
| Samoans | 6.9 /100 | #216 | Tragic 97.5% |
| South American Indians | 5.7 /100 | #217 | Tragic 97.5% |
| Immigrants | Nepal | 5.3 /100 | #218 | Tragic 97.5% |
| Immigrants | Panama | 5.2 /100 | #219 | Tragic 97.5% |
| Immigrants | Morocco | 5.0 /100 | #220 | Tragic 97.5% |
Demographics Similar to Immigrants from Ecuador by 3rd Grade
In terms of 3rd grade, the demographic groups most similar to Immigrants from Ecuador are Belizean (96.6%, a difference of 0.0%), Immigrants from Laos (96.6%, a difference of 0.010%), Immigrants from the Azores (96.6%, a difference of 0.010%), Immigrants from Burma/Myanmar (96.6%, a difference of 0.020%), and Immigrants from Guyana (96.6%, a difference of 0.030%).
| Demographics | Rating | Rank | 3rd Grade |
| Guyanese | 0.0 /100 | #306 | Tragic 96.7% |
| Nicaraguans | 0.0 /100 | #307 | Tragic 96.7% |
| Immigrants | Haiti | 0.0 /100 | #308 | Tragic 96.7% |
| Sri Lankans | 0.0 /100 | #309 | Tragic 96.7% |
| Cape Verdeans | 0.0 /100 | #310 | Tragic 96.6% |
| Immigrants | Guyana | 0.0 /100 | #311 | Tragic 96.6% |
| Immigrants | Laos | 0.0 /100 | #312 | Tragic 96.6% |
| Immigrants | Ecuador | 0.0 /100 | #313 | Tragic 96.6% |
| Belizeans | 0.0 /100 | #314 | Tragic 96.6% |
| Immigrants | Azores | 0.0 /100 | #315 | Tragic 96.6% |
| Immigrants | Burma/Myanmar | 0.0 /100 | #316 | Tragic 96.6% |
| Immigrants | Bangladesh | 0.0 /100 | #317 | Tragic 96.6% |
| Hispanics or Latinos | 0.0 /100 | #318 | Tragic 96.5% |
| Vietnamese | 0.0 /100 | #319 | Tragic 96.5% |
| Immigrants | Nicaragua | 0.0 /100 | #320 | Tragic 96.5% |