Austrian vs Immigrants from Ecuador Wage/Income Gap
COMPARE
Austrian
Immigrants from Ecuador
Wage/Income Gap
Wage/Income Gap Comparison
Austrians
Immigrants from Ecuador
28.4%
WAGE/INCOME GAP
0.2/ 100
METRIC RATING
298th/ 347
METRIC RANK
22.5%
WAGE/INCOME GAP
100.0/ 100
METRIC RATING
63rd/ 347
METRIC RANK
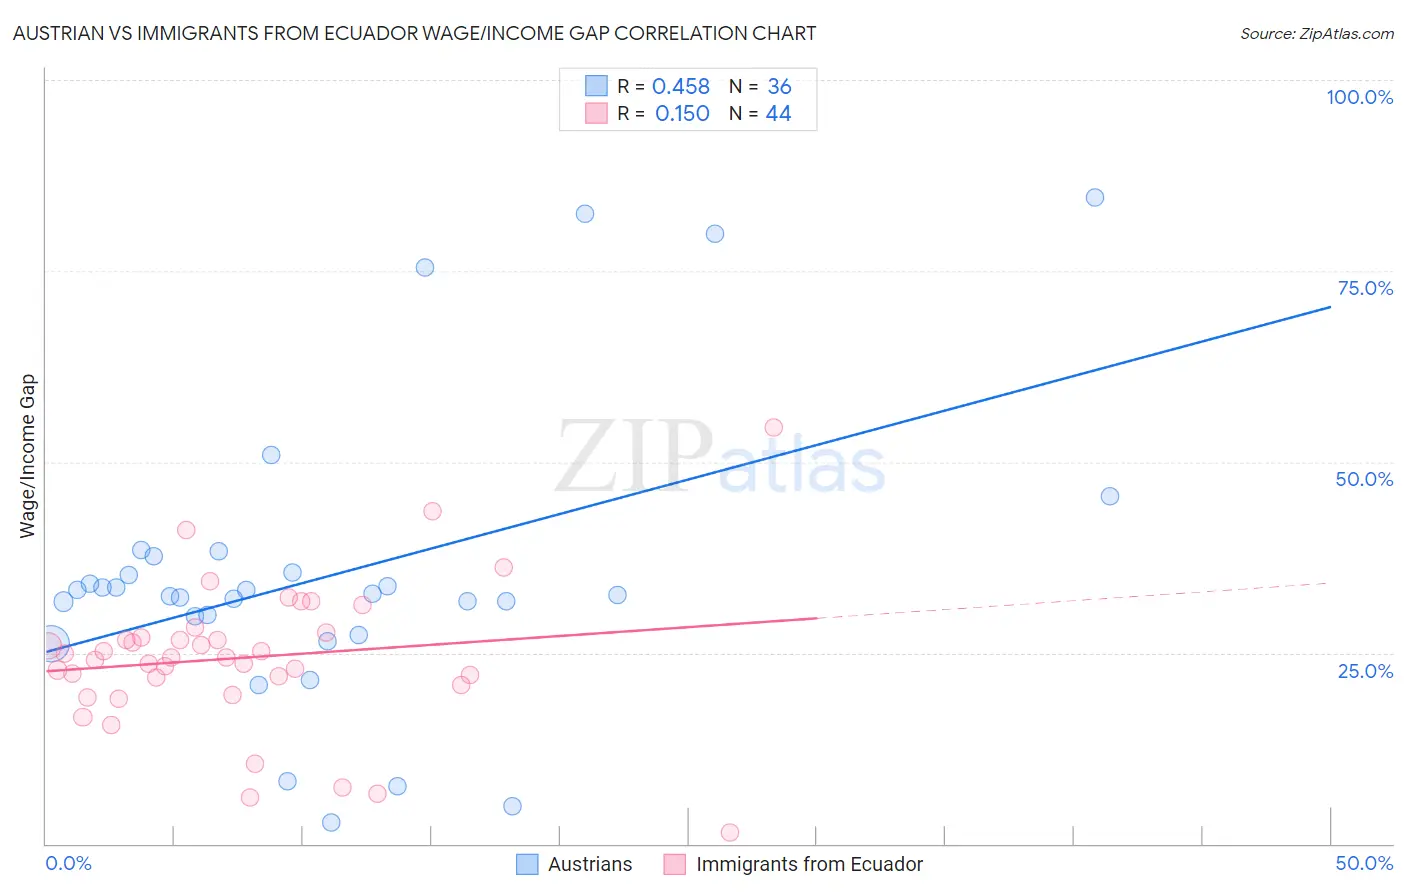
Austrian vs Immigrants from Ecuador Wage/Income Gap Correlation Chart
The statistical analysis conducted on geographies consisting of 451,520,484 people shows a moderate positive correlation between the proportion of Austrians and wage/income gap percentage in the United States with a correlation coefficient (R) of 0.458 and weighted average of 28.4%. Similarly, the statistical analysis conducted on geographies consisting of 270,894,682 people shows a poor positive correlation between the proportion of Immigrants from Ecuador and wage/income gap percentage in the United States with a correlation coefficient (R) of 0.150 and weighted average of 22.5%, a difference of 26.4%.
Wage/Income Gap Correlation Summary
| Measurement | Austrian | Immigrants from Ecuador |
| Minimum | 2.8% | 1.4% |
| Maximum | 84.6% | 54.5% |
| Range | 81.9% | 53.1% |
| Mean | 35.2% | 24.4% |
| Median | 32.6% | 24.4% |
| Interquartile 25% (IQ1) | 28.6% | 21.2% |
| Interquartile 75% (IQ3) | 36.7% | 27.3% |
| Interquartile Range (IQR) | 8.1% | 6.1% |
| Standard Deviation (Sample) | 19.2% | 9.6% |
| Standard Deviation (Population) | 18.9% | 9.5% |
Similar Demographics by Wage/Income Gap
Demographics Similar to Austrians by Wage/Income Gap
In terms of wage/income gap, the demographic groups most similar to Austrians are Immigrants from North America (28.4%, a difference of 0.0%), Immigrants from North Macedonia (28.4%, a difference of 0.050%), Immigrants from Northern Europe (28.5%, a difference of 0.16%), Immigrants from Canada (28.5%, a difference of 0.21%), and Scotch-Irish (28.5%, a difference of 0.24%).
| Demographics | Rating | Rank | Wage/Income Gap |
| Czechoslovakians | 0.3 /100 | #291 | Tragic 28.2% |
| Immigrants | Australia | 0.3 /100 | #292 | Tragic 28.2% |
| Immigrants | Israel | 0.3 /100 | #293 | Tragic 28.2% |
| Greeks | 0.3 /100 | #294 | Tragic 28.2% |
| Slovenes | 0.3 /100 | #295 | Tragic 28.3% |
| Northern Europeans | 0.3 /100 | #296 | Tragic 28.3% |
| Immigrants | North America | 0.2 /100 | #297 | Tragic 28.4% |
| Austrians | 0.2 /100 | #298 | Tragic 28.4% |
| Immigrants | North Macedonia | 0.2 /100 | #299 | Tragic 28.4% |
| Immigrants | Northern Europe | 0.2 /100 | #300 | Tragic 28.5% |
| Immigrants | Canada | 0.2 /100 | #301 | Tragic 28.5% |
| Scotch-Irish | 0.2 /100 | #302 | Tragic 28.5% |
| Irish | 0.2 /100 | #303 | Tragic 28.5% |
| Immigrants | Netherlands | 0.2 /100 | #304 | Tragic 28.5% |
| Immigrants | South Africa | 0.1 /100 | #305 | Tragic 28.5% |
Demographics Similar to Immigrants from Ecuador by Wage/Income Gap
In terms of wage/income gap, the demographic groups most similar to Immigrants from Ecuador are Immigrants from Guatemala (22.5%, a difference of 0.14%), Spanish American Indian (22.5%, a difference of 0.29%), Immigrants from Fiji (22.4%, a difference of 0.35%), Immigrants from Middle Africa (22.4%, a difference of 0.52%), and Navajo (22.4%, a difference of 0.54%).
| Demographics | Rating | Rank | Wage/Income Gap |
| Immigrants | Ghana | 100.0 /100 | #56 | Exceptional 22.3% |
| Ghanaians | 100.0 /100 | #57 | Exceptional 22.3% |
| Immigrants | Cuba | 100.0 /100 | #58 | Exceptional 22.4% |
| Navajo | 100.0 /100 | #59 | Exceptional 22.4% |
| Immigrants | Middle Africa | 100.0 /100 | #60 | Exceptional 22.4% |
| Immigrants | Fiji | 100.0 /100 | #61 | Exceptional 22.4% |
| Immigrants | Guatemala | 100.0 /100 | #62 | Exceptional 22.5% |
| Immigrants | Ecuador | 100.0 /100 | #63 | Exceptional 22.5% |
| Spanish American Indians | 100.0 /100 | #64 | Exceptional 22.5% |
| Guatemalans | 99.9 /100 | #65 | Exceptional 22.6% |
| Central American Indians | 99.9 /100 | #66 | Exceptional 22.7% |
| Menominee | 99.9 /100 | #67 | Exceptional 22.7% |
| Immigrants | Nigeria | 99.9 /100 | #68 | Exceptional 22.7% |
| Indonesians | 99.9 /100 | #69 | Exceptional 22.7% |
| Immigrants | Uzbekistan | 99.9 /100 | #70 | Exceptional 22.7% |